This post was authored by Xabier Ugarte Pedrero
In July 2017 we released PyREBox, a Python Scriptable Reverse Engineering Sandbox as an open source tool. This project is part of our continuous effort to create new tools to improve our workflows. PyREBox is a versatile instrumentation framework based on QEMU.
It allows us to run a whole operating system in a virtual environment (emulator), and to inspect and modify its memory and registers at run-time. A small set of QEMU modifications allows users to instrument certain events such as instruction execution or memory read/writes.
On top of this, PyREBox leverages Virtual Machine Introspection techniques to bridge the semantic gap, that is, understanding OS abstractions such as processes, threads, or libraries. You can find the more detailed description of the framework as well as its capabilities in the original blogpost.
In the past few months we have received positive feedback from the community, fixed bugs and added features suggested by the users. We also added support for GNU/Linux guests, and implemented an agent (program run inside the emulated guest) that allows file transfer between a host and a guest, as well as execution of samples in the guest on demand.
As part of this ongoing effort, today we are releasing a set of PyREBox scripts that are designed to aid malware analysis: Malware monitor. These scripts automate different tasks, such as code coverage analysis, API tracing, memory monitoring, and process memory dumping.
This new toolset also includes IDA Python scripts that help with visualization of the information extracted from the execution of a program. All these tools are configurable via JSON configuration files, and serve to assist automation of sample execution and analysis.
The scripts are released during the first public talk about PyREBox held as a part of the CommSec track at the Hack In the Box conference in Amsterdam. This blog post is a follow up with a brief explanation of the newly released features.
Code coverage
Understanding the code paths that get executed in a binary during the reverse engineering process can be very useful to researchers. While static analysis provides a fairly complete view of the code, we often cannot know in advance if a certain piece of code will get executed or not.
Analysis of code paths often demands anticipation of complex computations and non-trivial path conditions. In order to overcome this limitation, a reverse engineer will mix static analysis with dynamic analysis tools, such as sandboxes or debuggers. Understanding if a code path gets executed requires the reverse engineer to either trace the sample instruction by instruction, or to set breakpoints and let the sample run, waiting to hit one of the breakpoints at some point during the execution.
The first approach can be slow, while the latter may require many attempts, sometimes letting the sample to run freely, that is, not hitting any breakpoint, and fully infecting the system. This usually requires restoring the clean machine snapshot and restarting the analysis process.
In situations like this, having information about the code coverage is useful to better understand which instructions have been executed. The code coverage module in Malware monitor traces the execution of emulator translation blocks.
For the sake of simplicity, we can define translation blocks as equivalent to basic blocks, despite the fact that there are some differences in the way QEMU divides instructions into translation blocks and the formal definition of a basic block.
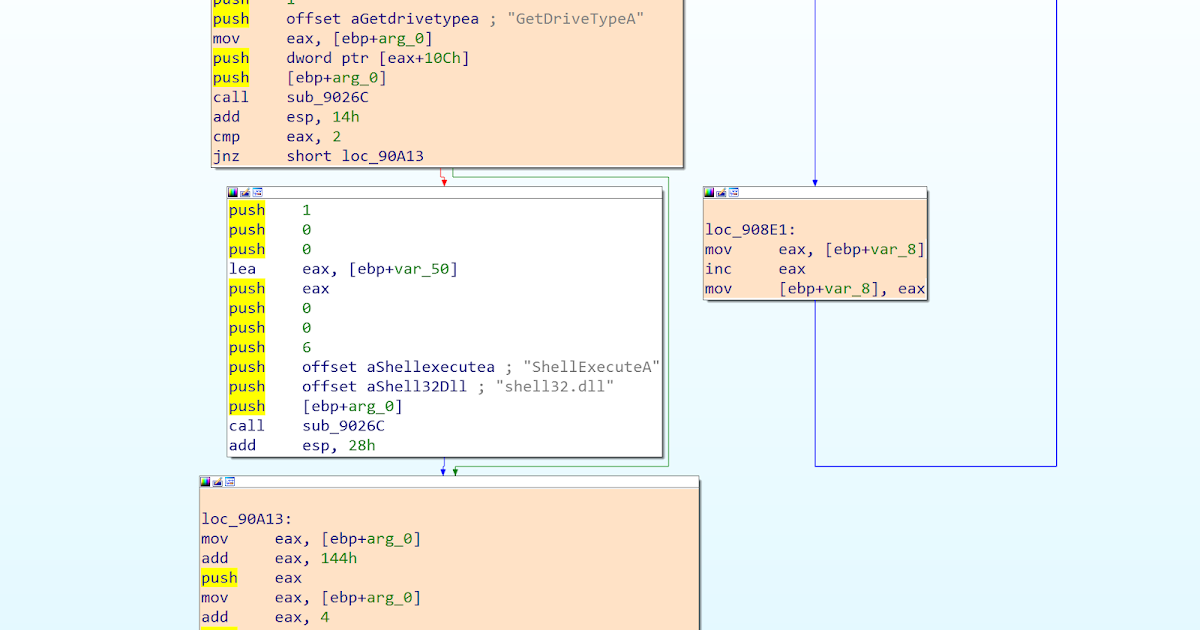
In any case, the code coverage module generates two different output files - a binary trace file, and a text summary. The binary trace can be imported into IDA in order to colorize the blocks of code that have been executed in the emulator. The user can then inspect at a glimpse which code paths were taken during the execution.
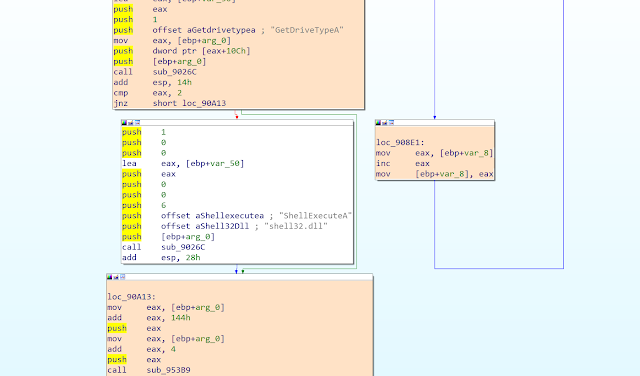
Figure 1. An IDA graph, in which the executed blocks have been colorized in orange, while the non-executed basic block remains white
The second file provides a coarse-grained summary of the executed memory regions. Moreover, it shows an execution transition whenever the execution jumps from one Virtual Address Descriptor (VAD) region to another. VADs are internal structures that Windows uses to keep track, in a form of a tree, of the different memory regions reserved in a given virtual address space.
The main module of the process, the imported DLLs, the stack, the heap, and other allocated memory regions are all represented as independent VAD regions in this tree. Therefore, this log allows the user to find points in the trace where the execution jumps into a memory buffer outside the main module or DLL, which is a behavior typically found in some run-time packers.
The log also includes addresses of the first instruction executed in every VAD region after each transition, helping in some cases to identify the Original Entry Point (OEP) of the unpacked binary.
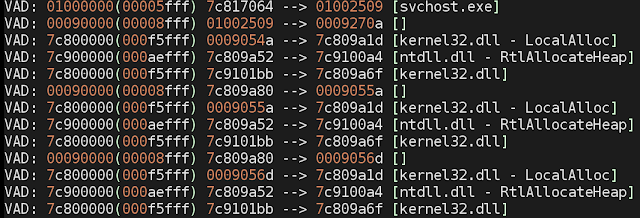
Figure 2. A snippet of a coverage text log file, showing several transitions between VAD regions.
API tracer
The second component of Malware monitor helps the user to understand the behavior of the sample by tracing function calls to common Windows DLLs (i.e., Windows API). The Malware monitor API tracing is done completely outside the guest system, while most other API tracing frameworks and sandboxes use traditional API hooking that requires modification of the process memory and introduces potentially detectable artifacts.
The API tracer module instruments only specific instructions (such as call / jmp), and detects when one of the control flow instructions jumps into the first bytes of any Windows API function.
API tracer can operate in two modes - the light mode and the full mode. If the light mode is enabled, it will only log API function calls, but it will not inspect their parameters, while the full mode also inspects the stack and registers every time an API function call occurs.
The full mode leverages a database containing information about the number of API parameters, their names and data types. The module is capable of dereferencing pointers and nested structures.
Generated information can either be written in a text file, or saved in a binary file and later loaded in IDA in order to be visualized. Once this information is imported in IDA there are two ways to visualize it - a dedicated tab with search capabilities, and a context menu displayed for every traced call.
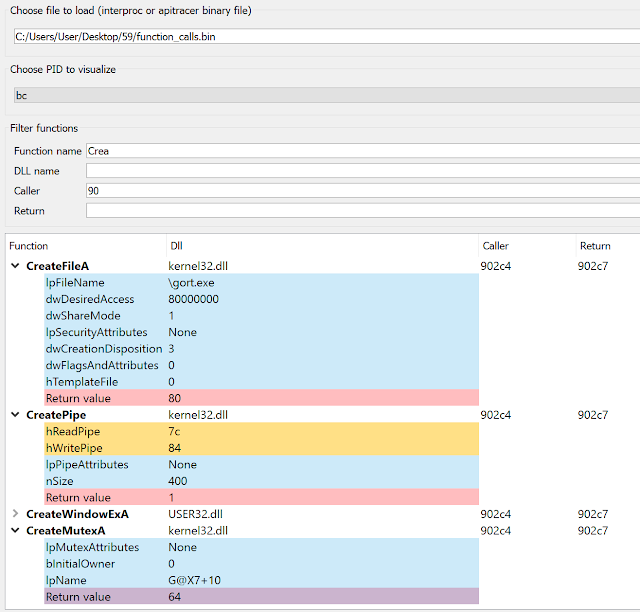
Figure 3. A dedicated tab is displayed in IDA, which allows to inspect function calls and their input and output parameters
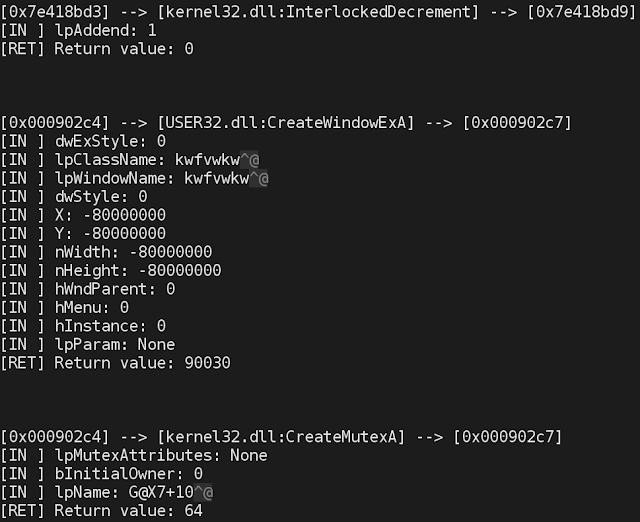
Figure 4. A snippet of a text log of the API Call trace
Memory monitor
The third new component, memory monitor, tracks different memory related events during the execution of a sample, including:
- Process creation
- Remote process memory reading and writing
- Memory sharing (shared memory regions)
- File writing and reading
- File mapping into memory
- Memory allocation
- Changes in memory access permissions
The monitored events allow the researcher to understand the memory related behavior of the sample, focusing on aspects such buffer unpacking, process creation and process injection. The module is also capable of monitoring file dropping events, that is, when the sample under analysis writes a binary to disk and executes it.
The information related to memory behavior is condensed into two reports. The first one contains all events related to the above categories, while the second one only summarises the collected information, showing the following:
- Started and injected processes
- Modules/DLLs loaded by these processes
- VAD regions for each process, including heuristics to mark those that contain potentially injected code, unusual permissions, as well as changes in their access permissions
- Memory maps (mapped files and memory sharing)
- Memory injections
- File operations
The summary information can be useful to gain a high level understanding of the malware bootstrap routines. Many malware families contain components that have to be deployed in the system memory. As a part of the deployment, malware often injects the payload into one or more system processes, creates other processes or drops files to disk.
The memory monitor component of PyREBox is able to provide initial information to the analyst containing the memory related behavior of the sample during the deployment phase.
Memory dumper
The last component of Malware monitor is a configurable memory dumper able to dump process memory, including the main module, loaded DLLs, as well as other memory regions (such as heaps, stacks and allocated buffers), at a certain point during execution. The appropriate point to dump the memory has to be chosen by the user, and is configured in the main JSON configuration file. Several options are allowed:
- Dumping memory at process exit.
- Dumping memory when a certain API function is called.
- Dumping memory when a certain address is executed.
In order to dump the memory at a point where the sample has been fully unpacked, the analyst needs knowledge about how the sample operates. However, other Malware monitor modules should be able to help the user to identify the point at which to dump the process memory.
Once the memory dump and the associated information concerning the memory regions of the process is created, we can load the dumped segments manually in IDA and conduct static analysis of the unpacked process.
Conclusion
These newly released Malware monitor components are useful for gathering sample execution information and complementing the data extracted from more traditional sandboxes and debuggers.
The presented modules can help the reverse engineer in the initial information gathering analysis phase, and they are just examples of how PyREBox can become an essential tool in the malware analysis workflow.
PyREBox is a powerful, highly versatile and customizable tool and we encourage every user to create their own scripts that adapt to their research areas.