By Cory Duplantis.
One of the ways vulnerability researchers find bugs is with fuzzing. At a high level, fuzzing is the process of generating and mutating random inputs for a given target to crash it. In 2017, I started developing a bare metal hypervisor for the purposes of snapshot fuzzing: fuzzing small subsets of programs from a known, static starting state. This involved working on a custom kernel that could be booted on bare metal. Having not done any operating system development before, I thought this would be a great way to learn new techniques while gaining a new tool for the tool bag. This is the story of the project in the hopes that others could learn from this experience.
The source code for barbervisor can be found here.
Goal
The simple goal of the project was to replay an x86 memory snapshot in a virtual machine (VM) using Intel's virtualization technology Intel VT-x. A snapshot in this case is the collection of system registers and memory at an arbitrary time in execution. Because the main purpose of a VM would be for fuzzing, precise locations of the snapshots are paramount. For example, if there is a file parser in a large GUI driven application, a snapshot could be taken after the GUI has been loaded and after an input buffer has been loaded. With the snapshot in hand researchers can quickly reset to this location, ignoring the precise computing time setting up everything before the parser was called.
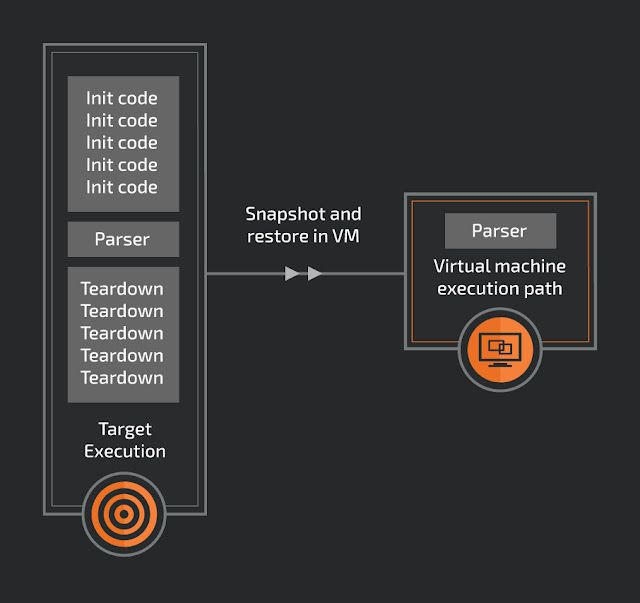
One of the many benefits of a snapshot is that the execution location doesn't need to have a clean internal state to restart. Because each snapshot will start from the same memory and register state, the VM could be stopped at any time. There is no need to find a clean loop in the target, making finding a snapshot location easier.
This was the bare minimum of what I wanted to achieve. The first step in development was to accomplish these goals:
- Given a memory/register snapshot, create a new VM with this snapshot.
- Execute the snapshot in the VM until a determined stop point.
- Compare the ending state with a known good state from an external hypervisor (VirtualBox in this case).
- Reset the VM.
- Modify the VM memory to create a known different path.
- Execute the snapshot in the VM until the new determined stop point.
With the overall goal in mind, let's see a potential path to this success.
(Full disclosure: no new bugs will be talked about in this blog. This is mostly talking about the steps I took for trying to research this idea.)
Kernel I knew that I needed a kernel that could boot on bare metal before getting started working on the Intel VT-x portion. At the time, I was also using this project as a gateway to learn Rust. While I didn't write the entire base kernel from scratch, leveraging elements from Philipp Oppermann's similar journey was a great first step into operating system development. I went and read each of his blog posts, cross-referenced the concepts on the OSDev Wiki, and re-implemented the kernel to learn in these early stages.
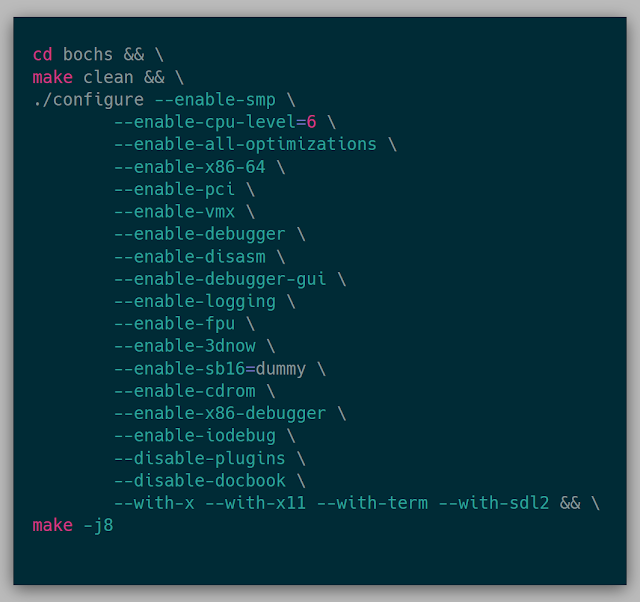
The key difference to the testing environment between Phil's blog and this project was I needed to test in Bochs instead of Qemu. Bochs is a fantastic x86 emulator that I needed for a few reasons:
- It's open-source, so we can add custom logging
- It emulates Intel VT-x
Running the kernel in Bochs was surprisingly easy. To use bochs, I needed to be sure it was built with vmx enabled:
With bochs built, the bochsrc is needed to tell Bochs what type of system to emulate. In the bochsrc, the generated .iso from building the kernel can be inserted into the cdrom to execute the kernel.
ata0-master: type=cdrom, path="build/os-x86_64.iso", status=inserted
boot: cdrom, floppy, disk
Alongside Bochs, I knew eventually I wanted to run this project on bare metal. The only extra machine I had around at the time was a Lenovo T460p. Getting the kernel running on the laptop was paramount to ensure I wasn't developing something that could only run in Bochs and not in the real world. Running the kernel on the laptop was also fairly simple using PXE. Setting up a TFTP server on the same network as the laptop and dropping the kernel into the TFTP directory allowed the kernel to be booted by the laptop. Loading the kernel every so often on the laptop ensured that the development was also in parity between Bochs and metal.
At this point, the kernel was:
- Booting in Bochs and metal
- Executing Rust (in 64-bit mode)
- Logging text to the screen (more on this in the Stats section)
- Allocating memory via a bump allocator
- Leveraging a page table for memory management
- Using Rust core collection such as Vec after setting up the global_allocator
With this initial kernel in hand, the actual process of learning about Intel VT-x could start.
Intel VT-x Learning about Intel VT-x happened alongside re-implementing the kernel for Barbervisor. Every night, a few pages were read from the Intel Software Developer's Manual in order to gain a context for the various concepts in Intel's virtualization solution: specifically, Chapters 23 through 28 in Volume 3. Not only was the read fairly straightforward, but it allowed me to have various reference points to information when I needed to look it up again (because this information was definitely not learned in one read). I believe I spent roughly a month between reading a few pages every night and actually formulating and writing code for the virtualization. The Bareflank and SimpleVisor projects were referenced to see what the concepts looked like in C++ as well.
A virtual machine (VM) in this case, conceptually, is separate code running on the same physical processor isolated to its own environment. The first phase of testing a VM is loading a few assembly instructions into a VM. Launching the VM will execute these instructions in the context of the VM. After the instructions are executed, the VM will exit, giving execution back to the kernel. This process, gleaned from the manual, should be:
VMXON -> Init VMCS -> VMLAUNCH -> VMEXIT
- VMXON: The instruction telling the processor that we want to use a virtual machine.
- Init VMCS: Initialize the VM Control Structure (and the biggest pain of this entire project).
- VMLAUNCH: Assuming a valid VMCS, execute the VM until an exit condition.
- VMEXIT: Exit the execution of the VM due to some VMExit reason.
The goal for this first phase was to run the following instructions in a VM:
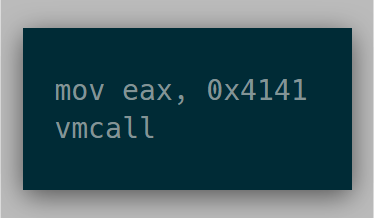
Assuming everything was set up properly, the vmcall instruction will cause the VM to exit, and the resulting eax value should read 0x4141.
VMCS
The Virtual Machine Control Structure contains all of the customizable fields needed to execute a given VM. Initializing this for the VM was easily the most time-consuming portion of this early development. Here's a representation of the fields:
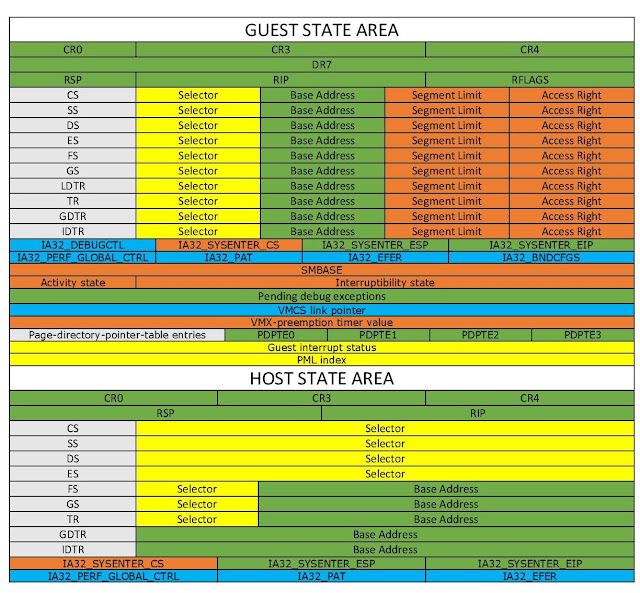
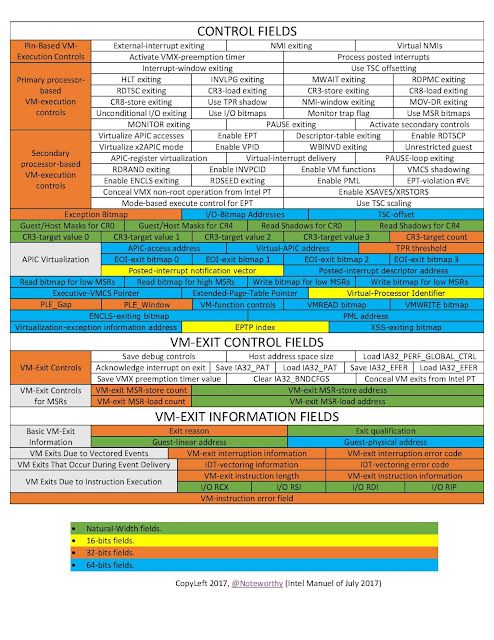
Credits: https://rayanfam.com/topics/hypervisor-from-scratch-part-1/
After initializing the VMCS itself, the instructions vmread and vmwrite are used to read and write these fields. For this basic case, for the majority of guest fields like segments and MSRs, it was easier to replicate what was already in a VM in a different hypervisor.
Initially, I copied over the guest state using information found in windbg. Any field that I didn't have information on, like MSRs, I wrote a dummy value like 0x11111111. The idea was that if an unknown field is actually needed, I could see an error somehow using these known dummy constants to know that these values are actually needed.
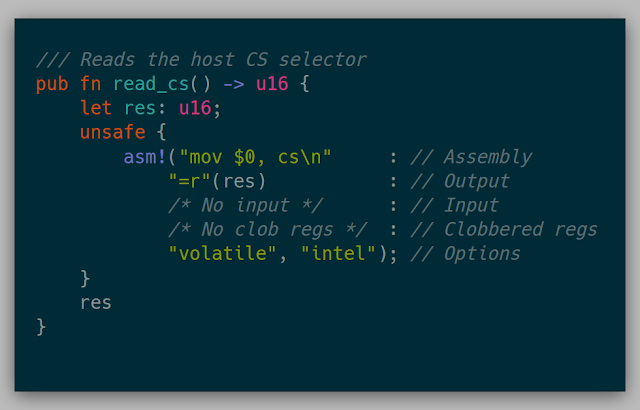
The host state of the kernel involved setting the host registers and segments in the VM to that of the host of the physical machine. Simple wrappers such as the one below were used to gather all of the host information (Note: this code is legacy and doesn't work anymore in current Rust.)
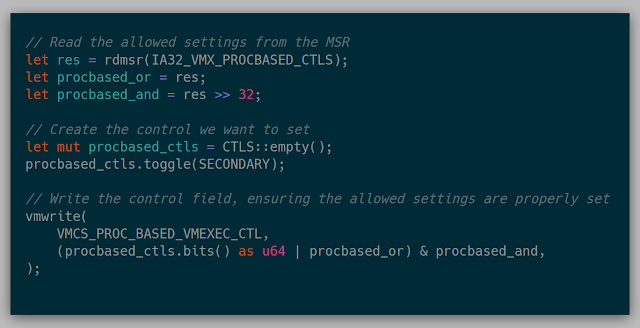
Then came the control fields. There is an MSR that can be read for each of the control fields which is a bitmask of both the allowed 0-settings and allowed 1-settings for that control field. There are specific fields that are only allowed to be 0 or 1. If the opposite occurs, then VM entry fails.
Eventually, I landed on the following code for each control field:
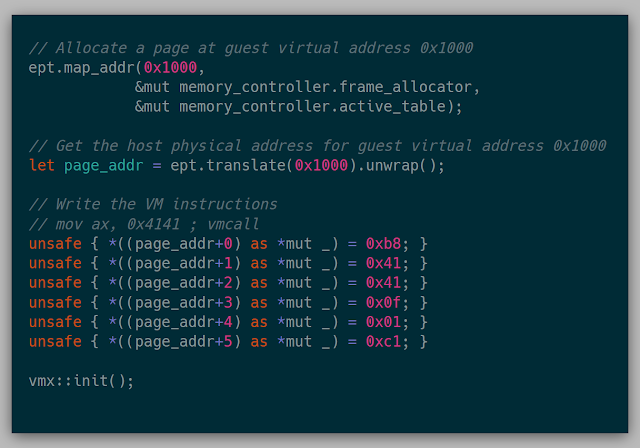
Lastly, I needed an EPT. The EPT is the Extended Page Table, which is a separate page table that the host uses to translate from the guest physical addresses to the host physical addresses. I had recognized when reading the chapter on EPT, that the form of the EPT and a 4 level page table (which was already implemented for the kernel) are very similar. The only difference was the flags for each entry in the page table itself. For the time being, I copied the entire original page table code, renamed all the PageTable references to ExtendedPageTable references and changed the entry flags to the correct EPT entry flags for READ, WRITE, and EXECUTE and it just worked (to my surprise). Lastly, the EPT is set in the VMCS so the VM knows which page table to use when translating addresses.
It should be noted here that there isn't a way, that I'm aware, to check these fields for validity in short spurts. It's more of an all-or-nothing game. Next, it was time to start the VM.
The very primitive API at the time could map memory into the EPT and translate the EPT addresses to get the host physical address. Ideally, this was the code that should run our wanted test case above:
This was finally the moment to see if things were good to go. Launching the VM... resulted in a VM Entry error. Lucky for us, there are over 100 checks to cross-reference in Chapter 26 to ensure things were properly initialized. I spent the rest of that day debugging trying to find the error, but no avail. The next weekend, the same process, step by step, check by check, looking for the one thing that was wrong, and still no dice. Part of this was due to my lack of confidence in the majority of my choices for VMCS field selections. At this point, I shelved the project for a good 2 months, due to my lack of knowing how to proceed with that seemed like an infinite amount of possibilities.
Snapshots
While the VM process was underway, I still wasn't sure how to snapshot, or even what that would mean in terms of this project. It occured to me one day in the shower (where many project problems seem to be solved), that I only needed a physical dump of a machine and a current register state to replicate a simple application. There was then a thought about how existing hypervisors keep and restore state.
Looking into VirtualBox, I discovered that there is a debugger that can be enabled on the command line by using --debug-command-line. Taking a look into the commands of the debugger, there is the ability to write a VirtualBox core dump to disk via writecore and also (thanks to Volatility) there is a .pgmphystofile command to dump the raw physical memory to disk, as well. The memory is available in the core dump, but with the raw physical dump, indexing into the physical memory is just simpler.
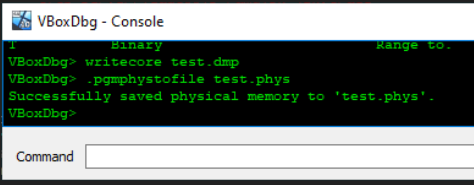
Since VirtualBox is open-source, the core dump format can easily be followed via the source and a parser can be implemented. All of the registers needed in the VMCS appeared to be in the core dump, so I went with snapshotting using VirtualBox. Once I discovered what exactly needed to be copied, it was apparent that nearly any existing hypervisor could be used to gain the same information.
The goal now is to snapshot a small application, precisely at the location where we want to fuzz.
VirtualBox snapshotting
The goal for this section was to snapshot a known application and modify memory to achieve a different result than in the original VM. The target application is:
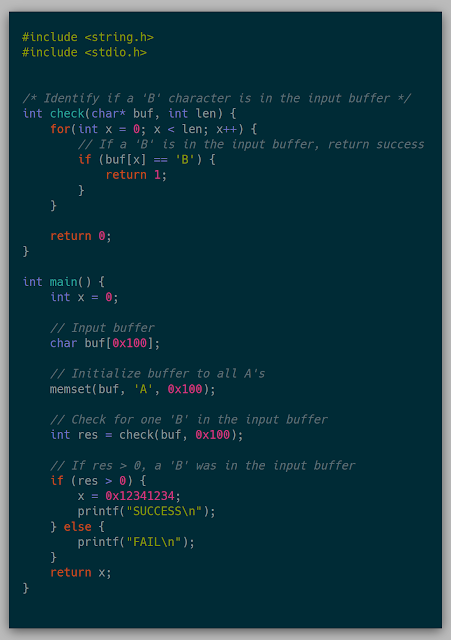
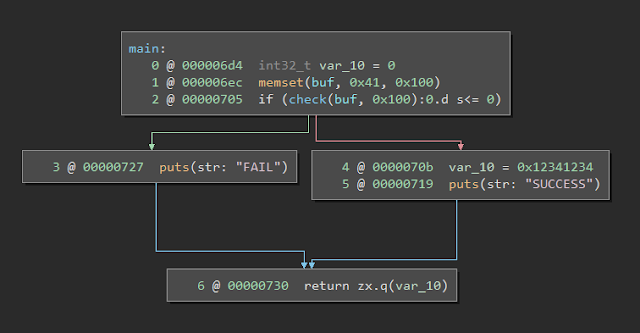
The execution path will always go into the FAIL case by default. The goal of the snapshot is to insert a B in the buffer after being loaded in a VM and see the execution go into the SUCCESS path.
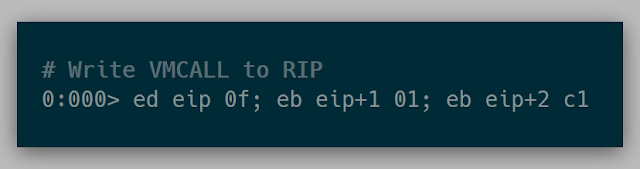
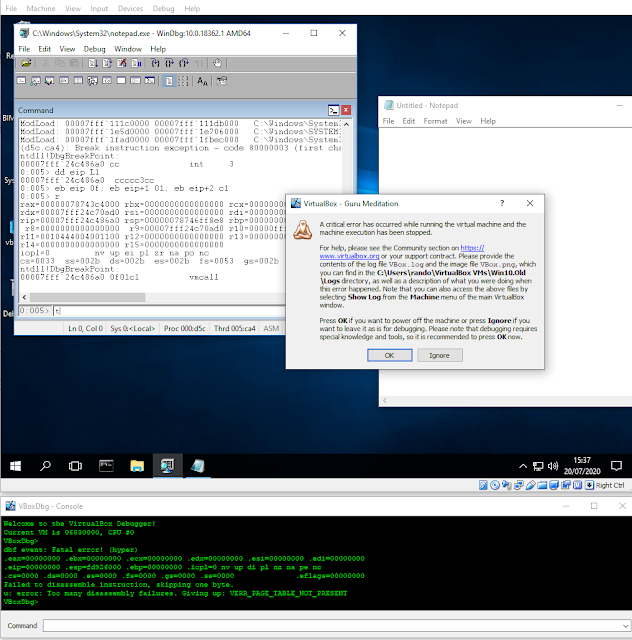
To snapshot the application, we compile and run the program in windbg in a Windows VM in VirtualBox. Stepping through the application until we are at the call to check(). It was at this point that I had a crazy idea, that I didn't think would actually work.
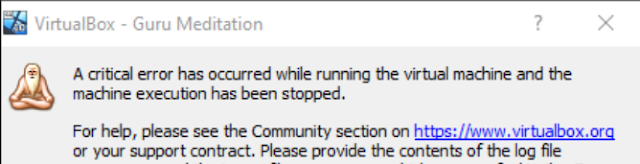
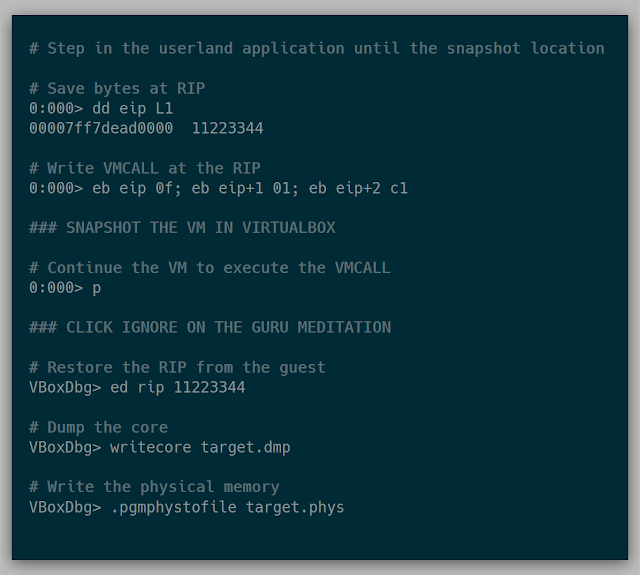
Knowing that vmcall is used to force a guest exit, I was curious what would happen if we used vmcall in VirtualBox. Overwriting the current call instruction with a vmcall and executing it is when I found out about VirtualBox's Guru Meditation:
(Note: This was tested on VirtualBox 5.2)
To my surprise, at this prompt if Ignore is clicked, the debugger comes into focus and commands can be used to produce a core dump and a physical memory dump from above. The current problem, though, is if we did a core dump now, the original instructions would be overwritten. Everything being the same though, this looked to be incredibly promising as a way to snapshot an entire system from a given userland location.
After a bit of tinkering, an example of the final steps are below:
Here is an example of snapshotting notepad.exe in a Windows 10 VM:
With a known snapshot mechanism in hand, it was time to figure out how to get the snapshot into my VM.
Restoring snapshot
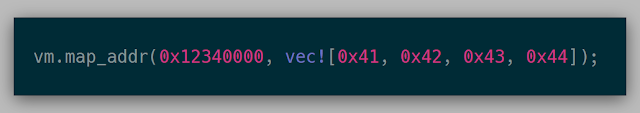
The API at this point for mapping memory looked like the following. Here, the guest physical address 0x12340000 contains the bytes 0x41, 0x42, 0x43, 0x44.
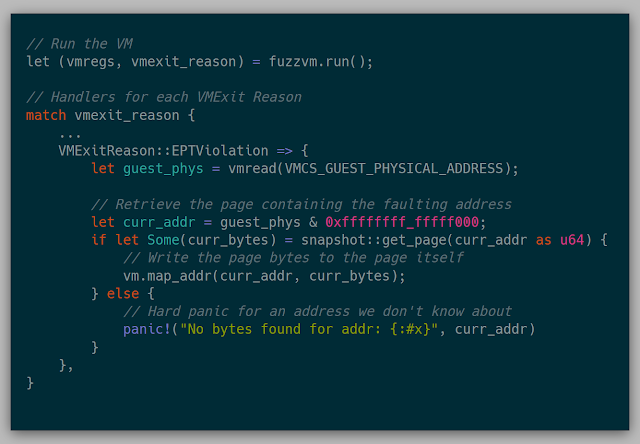
I realized the VM doesn't need the entirety of its memory loaded to actually execute. Loading memory pages on the fly can work just fine by using the EPTViolation VMExit. One condition that a VM can exit is if there is an error in the EPT, for example, if the executed or accessed page is not found. This can be leveraged by starting with a completely empty EPT, causing a VM Exit with the location of the fault, loading the faulting page, and then continuing execution of the VM. This method can be used to only load the memory needed to perform an execution rather than having to load a full 4G VM every fuzz run.
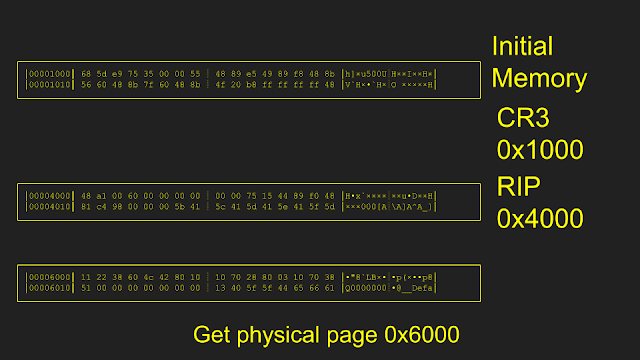
In code, this looked fairly simple as well. We match (similar to select) based on the reason the VM exited, then we read from the processor which guest physical address caused the EPT Violation. Using the found address, the bytes at that guest physical address are retrieved (more on that funny situation below), and then write those bytes to the required page.
Snapshot IN the kernel?
Observant readers may notice the call to snapshot::get_page above. Even with a snapshot in hand, I didn't have a method of getting the bytes into the kernel itself. There was no networking in the kernel for transmitting or receiving data. The kernel was PXE booted, but once the kernel was deployed, no information was getting in or out of the kernel other than through the screen. The solution to this? Compile the snapshot into the kernel. (While this worked, I highly, highly recommend against this.)
To compile the snapshot into the kernel, I created a parser for the core dump that dumped the entire page table found at the stored cr3 into a snapshot.rs file with the following form:
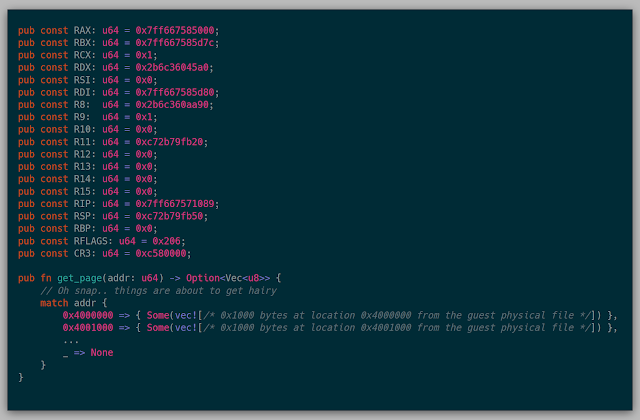
There was a giant match statement for each page found in the page table, and then a 0x1000 byte vec containing the bytes at that address. You might ask, "How long did that take to compile?" Well, on average, it was around 30 minutes to build the kernel to test various things. This should have been a huge red flag, but I just wanted the satisfaction of knowing that this process of loading pages one at a time actually worked.
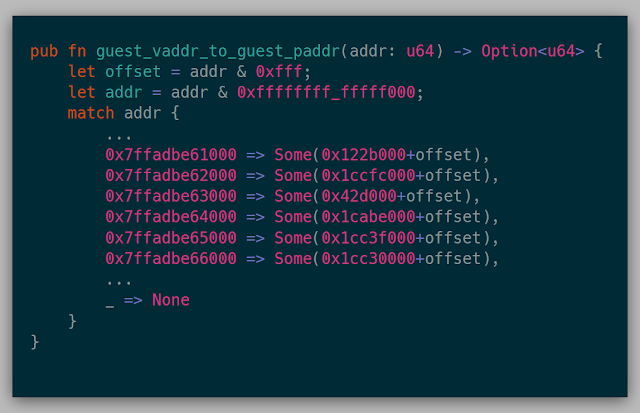
While constructing the parser for snapshot.rs, alongside the get_page() function, I also dumped a static guest virtual to guest physical page map since I was already parsing the current page table anyway. This way, the hypervisor has a direct mapping of guest virtual to guest physical pages without having to parse it itself. This API looked like:
Luckily, this process actually worked. Since this simple application actually used only 10 or so pages in memory, the first run through dumped all the mapped pages to the screen, and I just deleted all the other pages dumped in the snapshot.rs. That way I could actually have a quickish iteration cycle while still practicing on this snapshot.
With this smaller snapshot in hand, testing the idea of mutating memory was ready to test.
My first breakpoint
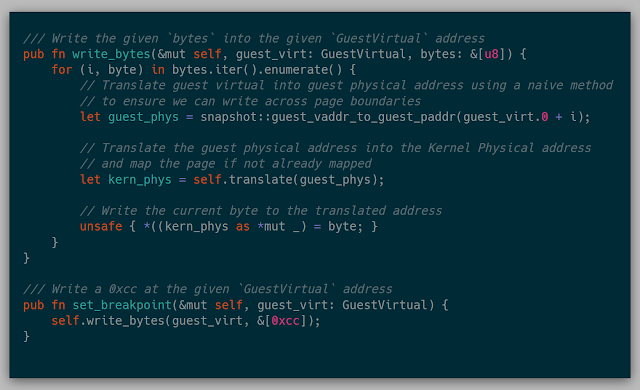
The last piece of the puzzle before executing the snapshot is figuring out how to stop a given execution. A possible solution could be to use the same vmcall instruction as before at a given instruction and catch every VMExit on the vmcall. Another solution is to write 0xcc for debug breakpoints at an instruction that we wanted to break at and then catch the Breakpoint VMExit. While those are fantastic solutions, at the time, I actually chose to force a divide by zero. A divide error could be seen as a VMExit and then the state of the process could be analyzed at that location.
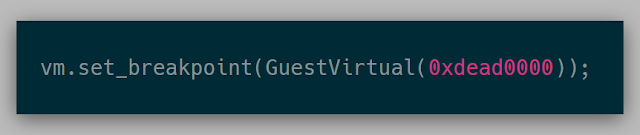
At this point, I realized that a generic u64 was a bit ambiguous when looking at addresses, so I decided to wrap u64 into GuestVirtual (note, this GuestVirtual is only applicable to the current cr3 in this implementation), GuestPhysical, KernelPhysical to allow the Rust compiler to sanity check the code to ensure the raw u64 numbers that I was using are actually what I care about.
For example, before the API looked like this:
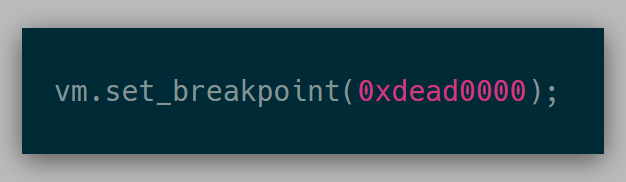
This API was ambiguous as to whether I wanted a breakpoint at guest virtual address 0xdead0000 or guest physical address 0xdead0000. The API at this point looked like:
This API built on the previous ability to translate memory and then write memory into memory:
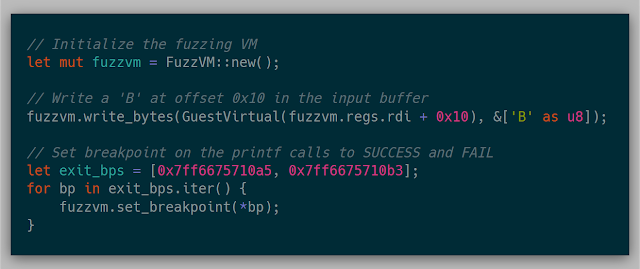
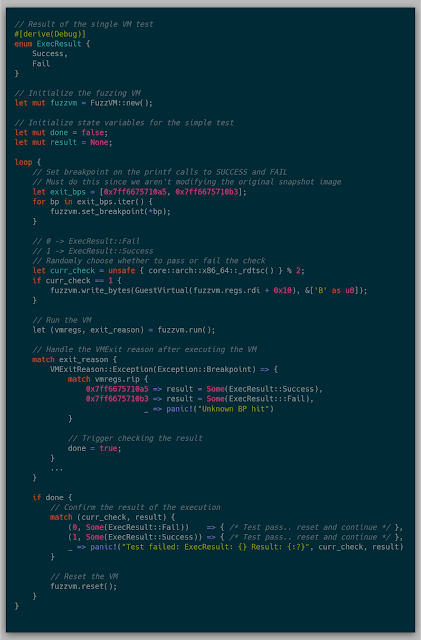
Because we can restore the original VirtualBox snapshot and execute it, we can also re-examine the existing system state after taking our snapshot. This way, we don't have to worry about gathering all relative information before taking a snapshot. I wanted to breakpoint on both the FAIL and SUCCESS printf calls so that if either of those were hit, the execution of the VM would stop. Restoring the original snapshot in VirtualBox, gives us that ability to look further in windbg and gather specific addresses and hardcode those addresses in the kernel.
This test case ends up looking like:
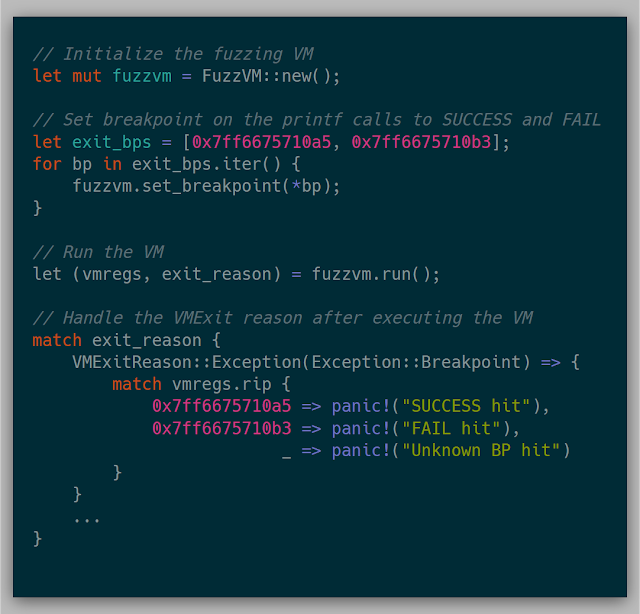
Without modifying the memory, the FAIL hit case is always hit. To check the initial goal, after creating the VM, modifying the input buffer should result in the SUCCESS hit case being hit.
With this change, the SUCCESS hit case was now hit! I honestly didn't believe this would happen, so I kept rebooting the laptop just to be sure the test case was properly implemented. As small as it sounds, this one test case was worth the weeks of work up to this point. Just a personal reminder that, while starting a large project with no knowledge is quite daunting, the rewards of learning and pushing through the project is immensely satisfying. It also reiterated the idea that knowledge isn't out of reach, but more so is a matter of time and investment.
Before I wanted to write this small chapter as a success, I needed to implement resetting the VM.
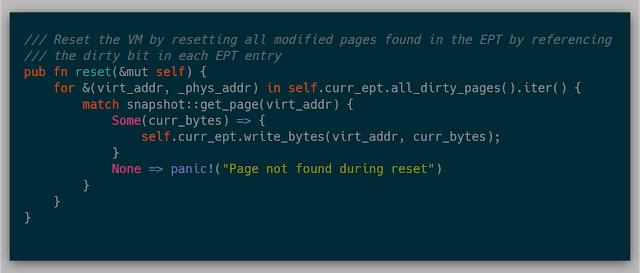
Resetting a VM
The beauty of resetting a VM is that resetting every page in the VM itself isn't necessary (this idea came from this talk). The EPT provides a "dirty bit" that is set if the page at a particular EPT entry was modified. Using this information, a simple page table walk tells the kernel which pages need to be reset, causing us to bypass many expensive page copies.
Below is the location of the dirty bit in the EPT entry from the Intel Manual:
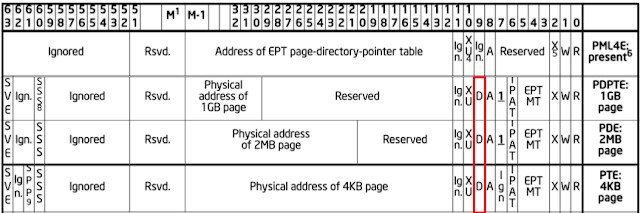
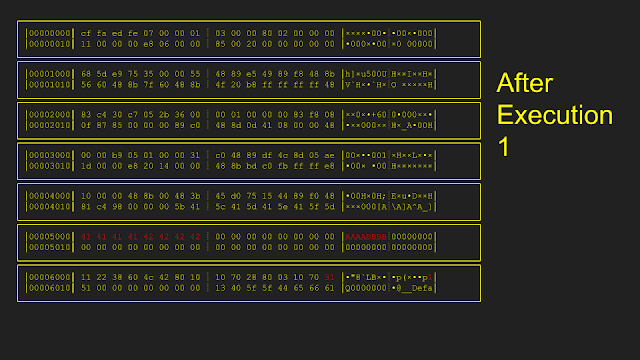
Here is an example of how the resetting is implemented. Starting from an initial memory state, only pages 0x5000 and 0x6000 were modified during the first execution. In order to reset, only pages 0x5000 and 0x6000 were copied from the original snapshot, leaving all other pages untouched. After the second execution, only page 0x4000 is modified. During reset the second time, only page 0x4000 is copied from the original snapshot.
The original implementation of this reset:
With .reset() implemented, I ran one final test to loop a single VM while resetting and randomly modifying memory. If the test passes, then any test case that doesn't modify memory should fail, or it'll succeed if the memory is modified.
And with that, a successful early "fuzz" case was executed.
In reality, fuzzing a target would be difficult with this method, but we can overcome that with a network driver. I slowed down on development for a few months knowing I had to overcome this hurdle. The task needed to mitigate this hurdle was a network driver. Even though I had just gotten to a huge milestone, I was still incredibly intimidated by the idea of implementing my own network driver. Knowing that I still had yet another (what seemed to be) daunting task ahead, I put the project down for several months.
Rebasing While I was taking this break, Orange Slice project spun up elsewhere. Orange Slice gave me the idea to use PXE as my primitive networking, so I forked orange_slice and re-worked the majority of Barbervisor to work on top of it. Because the memory allocator differed , the majority of the work involved reworking how Barbervisor allocated memory to use orange_slice's allocator.
After getting the last test case working in the new rebased project, I attempted to leverage PXE as a primitive networking strategy. A few hours later, I realized that, while this would be possible, it wouldn't be a long-term solution. This wasn't a useless endeavor, though, due to my new knowledge of PXE. This is a good example that even if a path of inquiry fails, the knowledge gained is still worth the exploration and research.
Network driver After some time to reflect and do some additional research, I decided to implement the driver and enable networking with the kernel.
The main two reasons why enabling networking would be useful for this project are:
- Instead of compiling the snapshot into the kernel, the kernel can request a page over the network to add to the VM.
- Data can be arbitrarily sent/received to/from the kernel. This was immensely important for getting things like a full execution trace or a successful fuzz case out of the kernel.
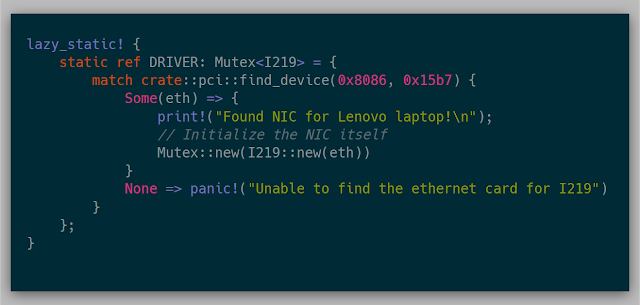
Since the network driver could be used by multiple cores, wrapping the driver in a Mutex allows each core to access the NIC whenever they need. Leveraging the lazy_static crate allows the NIC to be initialized once as a static at runtime. This code will hard panic if the only available NIC wasn't found via PCI. Otherwise, I initialize the NIC and set it in the Mutex.
I structured this packet by forking the smoltop project and adding on a TFTP layer.
Implementing the network driver was the single most important feature of the project. Moving data in and out of the kernel was quintessential for every other feature moving forward. When I go back to re-implement the project again, a network driver will be one of the first features after getting kernel execution and memory allocation implemented for sure. Hindsight is 20/20 for sure, but that is the beauty of research.
With the network driver implemented, I could move into looking at snapshots loaded over the network.
Snapshots over the network I also implemented a TFTP so I could have full control over the server and add other features. tftp64d was used originally for testing, but was replaced for the custom server.
I also added two new commands to the TFTP server:
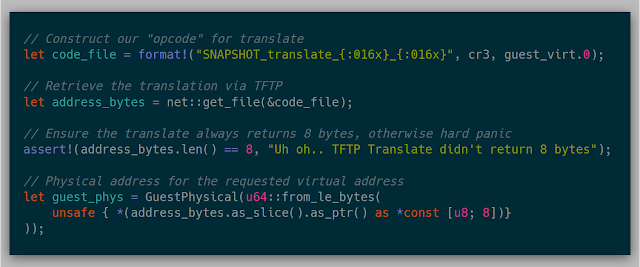
- SNAPSHOT_translate_0xc3000_0x120000: Translates the guest virtual address (second) using the CR3 (first).
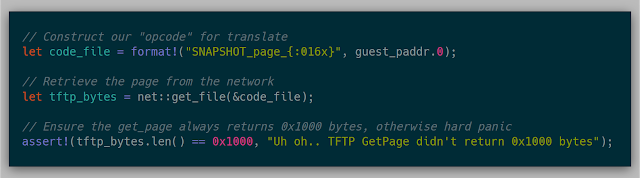
- SNAPSHOT_page_0x2000: Returns the page-aligned physical page located at the given guest physical address.
This format so far works just fine. It obviously wasn't the best design choice, single byte opcodes would be better.
With these two new features, replacing the previous snapshot API was fairly simple. The previous snapshot::guest_vaddr_to_guest_paddr function now can work over the network:
And the snapshot::get_page function also can now work over the network:
With these two fixes, snapshots are now retrieved on the fly and over the network using the same loading pages method mentioned before. The original testing case still worked as planned.
Basic Multicore design
Now that a single core can load, execute, and reset a single VM, it was time to try to spin up multiple cores to parallelize the work. The API, from Orange Slice, for this was simple:
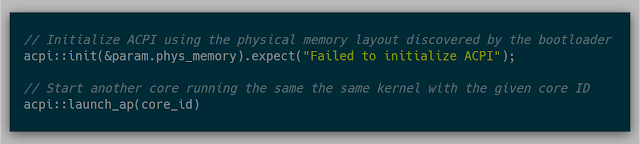
This API was used by initializing ACPI at the first execution of the kernel and then at another point, launching some or all of the other cores. A simple check of whether the current core is the boot system processor (BSP) or not tells the kernel if it is executing as the first core.
The test case for a successful launch of multicore was to run the exact same test case and after reaching either breakpoint, launching the next core if there are still cores left to launch.
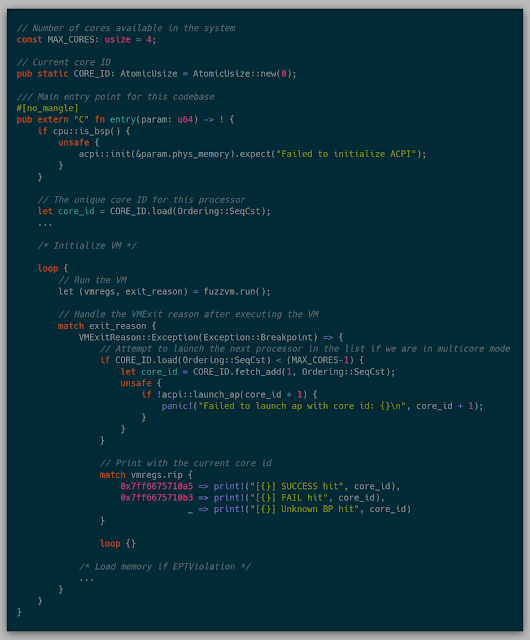
The flow for this fuzzing test is as follows:
- If the kernel starts and is BSP, initialize ACPI.
- Initialize a fresh VM for this core.
- Execute the VM until completion, while caching all pages retrieved from the network.
- Once the finish breakpoint has been reached, a new core is launched if there are any cores left.
Since all cores will at least need all the pages of the original, non-fuzzed execution path, the first core executes the original execution path by itself. This execution caches all pages retrieved from the network in memory. From this point forward, before any page is requested over the network, the kernel checks to see if it has already retrieved that page first. In this way, we aren't retrieving the same page number-of-cores times over the network and instead it copies the cached page.
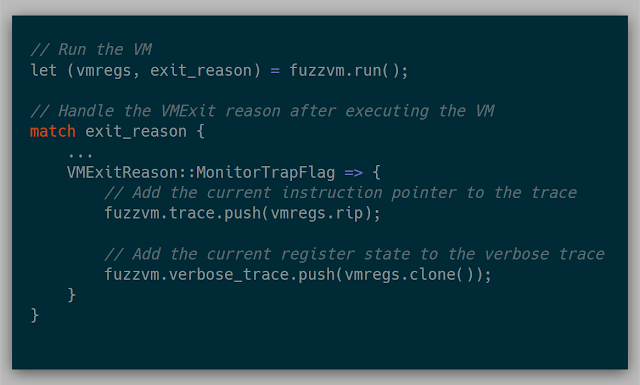
Tracing
To enable single-step tracing, Intel VT-x provides a useful feature called the "Monitor Trap Flag" (Section 25.5.2 Intel Manual). If this flag is set in the VM Execution Control in the VMCS, the VM will exit every instruction with a MonitorTrapFlag exit reason. This allows the kernel to record the state of the VM, and then continue execution.
For keeping track of the trace, each core keeps two traces: one that stores only found addresses and another that stores the register state for a more verbose trace. The address trace is useful for general tracing and the verbose trace is useful for debugging and cross-referencing the actual trace from VirtualBox.
Implementing these is quite simple:
At any given point, each trace could be shipped over to the TFTP server. The main idea was to collect the data in the kernel and then ship it over to the server for further parsing. Because we also have the full physical memory, digital forensic ideas can be used to convert found addresses into a much cleaner module!exported_function+offset syntax.
By passing the collected addresses through a trace parser, a trace can return a more valued result like below:
[15738] USER32.dll+0x00027750, (0x7ffe4d3c7750) 0x7ffe4d3c7750: cmp dword ptr [rip + 0x82179], 5
[15739] USER32.dll+0x00027757, (0x7ffe4d3c7757) 0x7ffe4d3c7757: je 0x7ffe4d3c7760
[15740] USER32.dll+0x00027759, (0x7ffe4d3c7759) 0x7ffe4d3c7759: jmp qword ptr [rip + 0x629d8]
[15741] win32u.dll+0x000011d0, (0x7ffe4a5c11d0) 0x7ffe4a5c11d0: mov r10, rcx
[15742] win32u.dll+0x000011d3, (0x7ffe4a5c11d3) 0x7ffe4a5c11d3: mov eax, 0x100d
[15743] win32u.dll+0x000011d8, (0x7ffe4a5c11d8) 0x7ffe4a5c11d8: test byte ptr [0x7ffe0308], 1
[15744] win32u.dll+0x000011e0, (0x7ffe4a5c11e0) 0x7ffe4a5c11e0: jne 0x7ffe4a5c11e5
[15745] win32u.dll+0x000011e2, (0x7ffe4a5c11e2) 0x7ffe4a5c11e2: syscall
[15746] ntoskrnl.exe!KiSystemCall64Shadow+0x0, (ntoskrnl.exe+0x330140) 0xfffff803461e1140: swapgs
[15747] ntoskrnl.exe!KiSystemCall64Shadow+0x3, (ntoskrnl.exe+0x330143) 0xfffff803461e1143: mov qword ptr gs:[0x7010], rsp
[15748] ntoskrnl.exe!KiSystemCall64Shadow+0xc, (ntoskrnl.exe+0x33014c) 0xfffff803461e114c: mov rsp, qword ptr gs:[0x7000]
[15749] ntoskrnl.exe!KiSystemCall64Shadow+0x15, (ntoskrnl.exe+0x330155) 0xfffff803461e1155: bt dword ptr gs:[0x7018], 1
[15750] ntoskrnl.exe!KiSystemCall64Shadow+0x1f, (ntoskrnl.exe+0x33015f) 0xfffff803461e115f: jb 0xfffff803461e1164
[15751] ntoskrnl.exe!KiSystemCall64Shadow+0x24, (ntoskrnl.exe+0x330164) 0xfffff803461e1164: mov rsp, qword ptr gs:[0x7008]
[15752] ntoskrnl.exe!KiSystemCall64Shadow+0x2d, (ntoskrnl.exe+0x33016d) 0xfffff803461e116d: push 0x2b
[15753] ntoskrnl.exe!KiSystemCall64Shadow+0x2f, (ntoskrnl.exe+0x33016f) 0xfffff803461e116f: push qword ptr gs:[0x7010]
[15754] ntoskrnl.exe!KiSystemCall64Shadow+0x37, (ntoskrnl.exe+0x330177) 0xfffff803461e1177: push r11
[15755] ntoskrnl.exe!KiSystemCall64Shadow+0x39, (ntoskrnl.exe+0x330179) 0xfffff803461e1179: push 0x33
[15756] ntoskrnl.exe!KiSystemCall64Shadow+0x3b, (ntoskrnl.exe+0x33017b) 0xfffff803461e117b: push rcx
[15757] ntoskrnl.exe!KiSystemCall64Shadow+0x3c, (ntoskrnl.exe+0x33017c) 0xfffff803461e117c: mov rcx, r10
[15758] ntoskrnl.exe!KiSystemCall64Shadow+0x3f, (ntoskrnl.exe+0x33017f) 0xfffff803461e117f: sub rsp, 8
[15759] ntoskrnl.exe!KiSystemCall64Shadow+0x43, (ntoskrnl.exe+0x330183) 0xfffff803461e1183: push rbp
The other useful idea is to parse the collected trace into a module+offset form for input into Lighthouse. This has been useful to have around for checking on the status of how a fuzzer is currently progressing.
While a full trace is fantastic, if the goal is coverage guided fuzzing, then coverage is actually useful. A trace is the full execution path of a target, whereas coverage is a sparse subset of instructions hit during the execution that isn't necessarily recorded in order. The next useful step after gathering the trace is to implement some form of coverage mechanism.
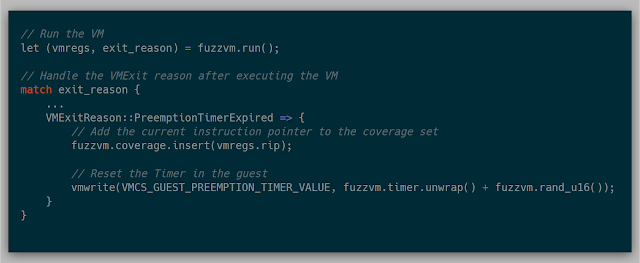
Coverage
There are several ways to trigger coverage events in the processor. The method that was implemented for this project utilizes the "VMX-Preemption Timer" (Section 25.5.1 in the Intel Manual). The preemption timer counts down from a given value based on the timestamp counter. Once the timer hits zero, a PreemptionTimerExpired VMExit is triggered. The timer's countdown speed can be adjusted via the IA32_VMX_MISC MSR (Appendix A.6 in the Intel Manual).
Much like tracing with Monitor Trap, gathering coverage with the preemption timer is fairly simple. By setting a random number in the "VMX-preemption timer-value" field and activating the preemption timer in the VM execution controls in the VMCS, the timer is enabled. Once the timer expires, an VM Exit can be triggered and handled:
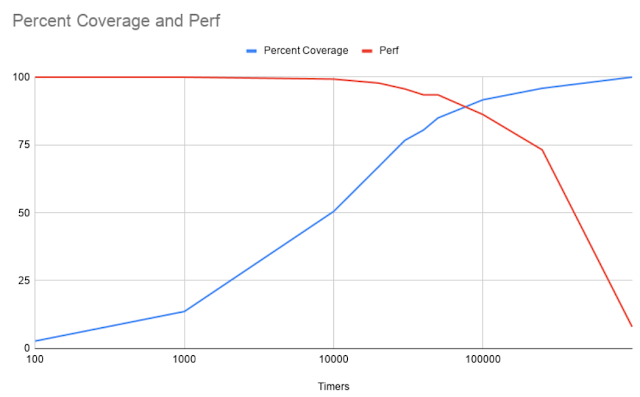
Because each coverage event triggers a VMExit, the performance of each VM can be affected. To roughly calculate this, I needed to measure how long a given execution, without fuzzing, takes without VMExits as well as the total number of unique instructions. From there, I tuned the coverage to generate increasingly more VMExits/second and then ran the execution in a loop for 60 seconds. After execution, because I already had the number of instructions from a full trace, I recorded the percentage of coverage that the current number of VMExits/second found. I repeated this step three times per testing number of VMExits/second to try and get a small sample size average. In this way, this could potentially show what the cost is of gathering coverage for this particular snapshot.
With tracing and one basic coverage mechanism in place, the last step I wanted was a practical fuzzer interface that would be interesting to write fuzzers in.
impl Fuzzer
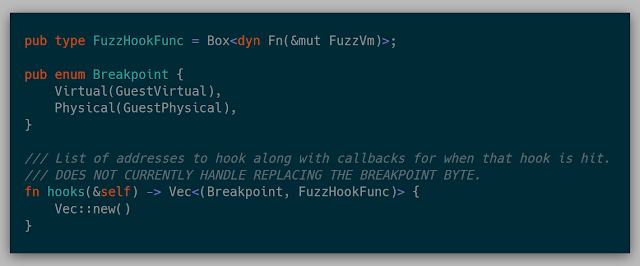
While I know I can modify all the internals of the hypervisor whenever needed, I wanted to abstract away any fuzzer so that each fuzzer is isolated from the hypervisor mechanics themselves. The hypervisor is aware of this interface, so implementing some/all of these methods would enable the fuzzer. The full trait is:
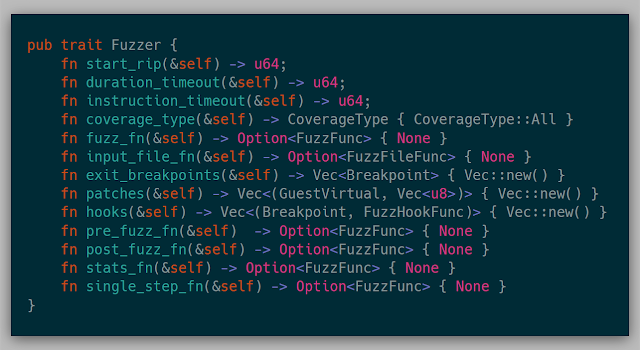
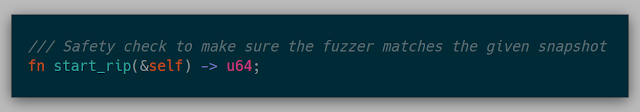
After being bit multiple times by mismatched snapshots and fuzzers, each fuzzer needs to verify itself by mentioning the starting address that it should start with. This is checked once the snapshot is shipped over the network.
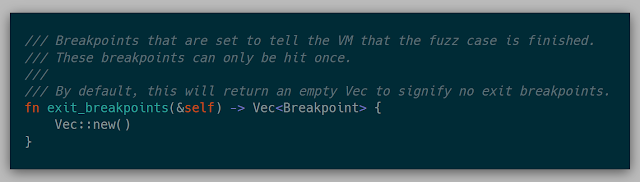
If a fuzzer wants to stop execution and reset if a given location is seen during the execution, it can specify these locations in exit_breakpoints.
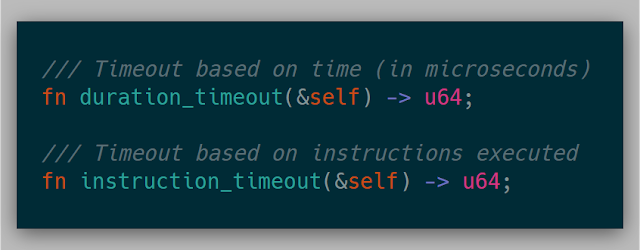
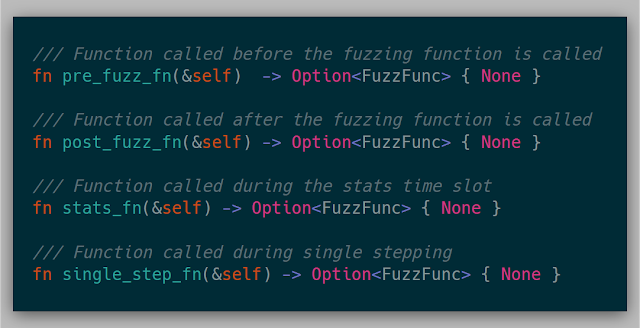
A fuzzer could also say that it wants to reset after a number of microseconds have elapsed or a number of retired instructions have been seen (via IA32_PERF_FIXED_CTR0, 19.13 in the Intel Manual).
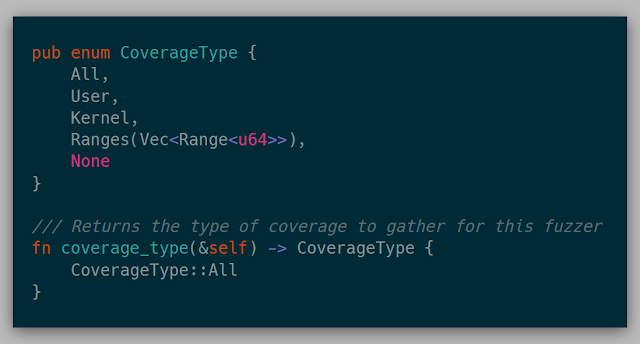
Various coverage ideas could be specified as well: only user mode, only kernel mode, only specified address ranges, every instruction seen, or no coverage at all.
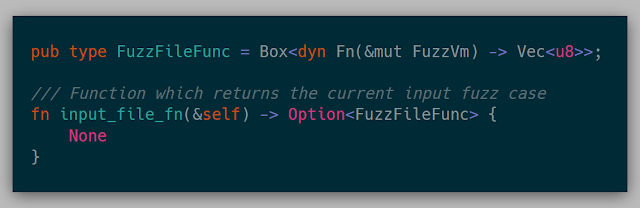
This function returns a function that returns the input bytes from the given VM for the given fuzz case. This could be reading bytes from a register or returning a number of bytes from a hardcoded address. This function is used to save the test case generated if it resulted in more coverage.
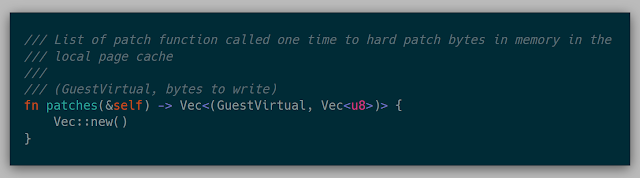
A Fuzzer can also implement patches to a given snapshot. This will write the given bytes into the current page of the VM as well as permanently changes the bytes in the page cache.
A Fuzzer can also implement a hook for a given address. These hooks are effectively a breakpoint that then calls a closure.
There are also a variety of closures that could be called at various locations in the fuzz cycle.
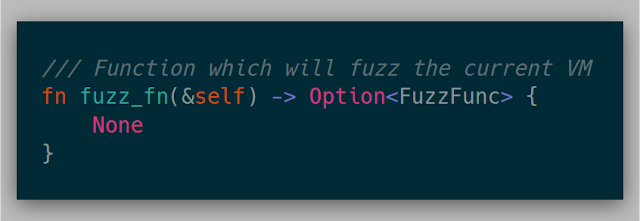
Finally, the fuzz_fn is called at the beginning of each fuzz case. This function is where modifying memory for each fuzz case is implemented. This function could not be implemented and could just be used as a coverage mechanism for tracing or debugging.
Here is an example of a dumb byte-flipper:
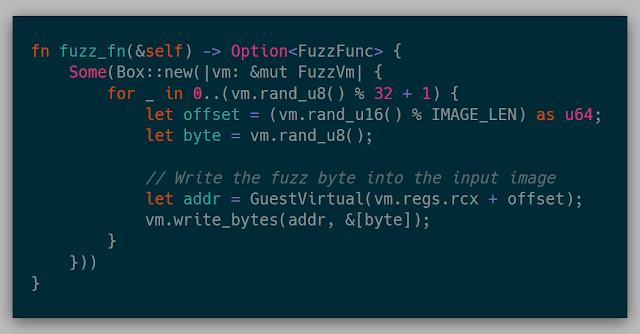
In this example, we are simply mutating one input file in place rather than a corpus just for simplicity. In this snapshot, the input file happens to already be pointed to by rcx. This function will corrupt up to 32 random bytes in the known input file of size IMAGE_LEN.
Another example could be to replace an input file with a mutated file from a corpus.
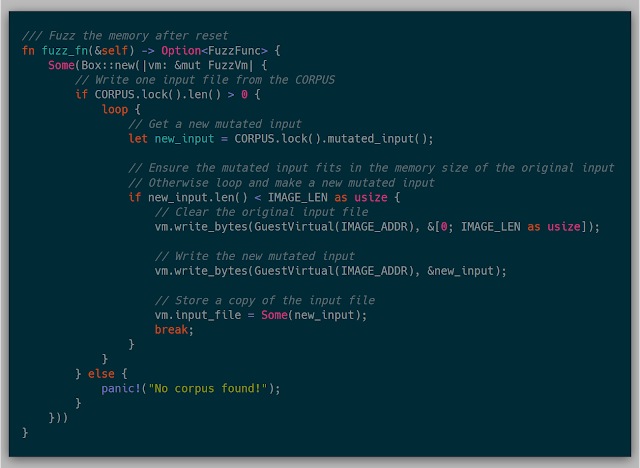
Here we are selecting a file from a global corpus and then mutating it using an implementation of ni. In this particular case, the original image was cleared and then overwritten with the mutated input.
Stats
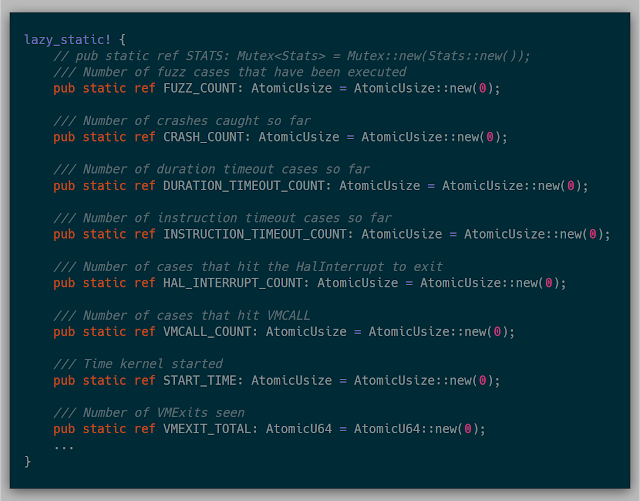
Along with the mechanics of fuzzing, gathering statistics about the system helps with discovering where time is spent in the fuzzer to know where various bottlenecks exist. This implementation uses several global atomic variables for keeping track of stats. Since my test environment was only a four-core machine, this was acceptable. If I had more cores, this would probably bottleneck on the atomics themselves, as locking the atomic over dozens of cores is quite slow, but for this research, it wasn't as much of an issue.
An example of some of the stats collected in these atomics are:
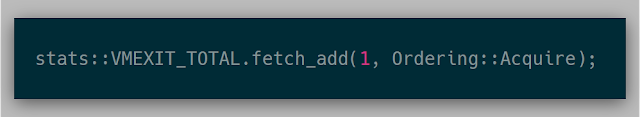
Once initialized, anywhere in the kernel various stats can be adjusted quite easily:
The output for these stats were displayed in a table on the laptop itself.
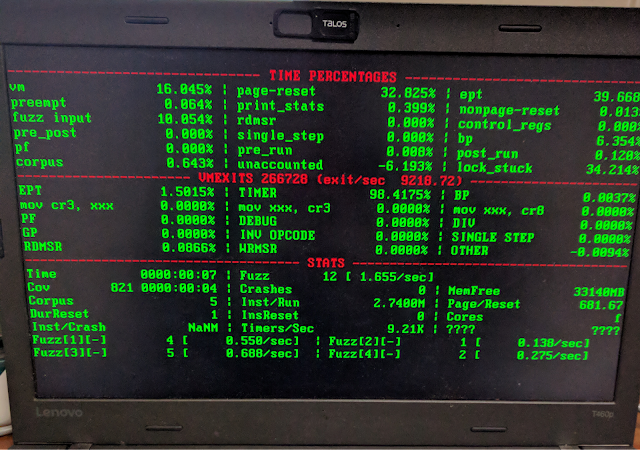
The stats that I cared about at the time were the timing of each type of VMExit as well as various functions for the overhead of the hypervisor itself, particularly how fast resetting a VM took.
Limitations I'm very proud of how far I've come with this project after years of work. After working through a few known bugs, there are still a handful of limitations.
Devices Devices aren't currently emulated at all with the project, so if any device is queried, this is considered a hard reset case. For example, all of the Windows 10 traces that I've tried thus far have traversed through HalRequestSoftwareInterrupt before querying a device (which was quite easy to find due to gathering a full system trace). Knowing that, the TFTP server could insert a breakpoint into HalRequestSoftwareInterrupt if that function has been seen in a page being deployed. In this way, that page always has a breakpoint.
Modules in memory Since everything revolves around a snapshot, if there is code requested that is not in the snapshot (for example a module that hasn't been loaded yet by the target), then that code can't get executed. My current workaround so far has been to advance the snapshot past the modules being loaded and then re-snapshot. This probably wouldn't work in all cases, but it has worked for the few tests that I've run across thus far.
Slow iteration cycles In order to test changes in the kernel, the kernel must be rebuilt and redeployed to the hardware. This makes for an incredibly long iteration cycle for testing new ideas. The work around for this would be to clean the kernel state, drop back down to 16 bit mode, and then reload a new snapshot over the network. In this way, the kernel could trigger to reset itself without having to reboot the hardware. While not being the most efficient, the current implementation was at least effective in testing these research ideas.
Rust updates Due to the nature of writing a hypervisor, much of the code leverages nightly features of Rust that haven't been stabilized yet. This can cause code to break arbitrarily due to changes made by the Rust team. This could be seen as a limitation for some or as a way of learning various features of the language. I found that I was more up to date on various features of the language due to some of them changing out from under me.
Wrapping up I hope this provided a proper overview of how much development and research went into Barbervisor. While I continue the project, I'd like to share several of my main takeaways:
- Learning Rust alongside hypervisor tech wasn't a hindrance.
- Reading the Intel Manual for learning Intel VT-x wasn't a huge hassle.
- Bochs was the must have tool for debugging Intel VT-x.
- Initializing giant config blocks like VMCS one step at a time is doable.
- VirtualBox snapshotting worked, but isn't a necessity (other hypervisors would work just fine).
- Network driver was an absolute necessity and isn't as daunting as previously thought.
- Dirty bit VM reset was incredibly useful and simple.
- Snapshot loading over the network is extremely useful.
- It's OK to lose motivation on a passion project. All that being said, this is just the tip of this research iceberg. This has mostly been a project for the goals of understanding if this new technology could be used as another method for fuzzing.