10/20/20 Update: A new version of this software and associated blog can be found here
Executive summary Static reverse-engineering in IDA can often be problematic. Certain values are calculated at run time, which makes it difficult to understand what a certain basic block is doing. If you try to perform dynamic analysis by debugging a piece of malware, the malware will often detect it and start behaving differently. Today, Cisco Talos is releasing the 1.0 beta version of Dynamic Data Resolver (DDR) — a plugin for IDA that makes reverse-engineering malware easier. DDR is using instrumentation techniques to resolve dynamic values at runtime from the sample. For the 1.0 release, we have fixed a couple of bugs, ported it to the latest IDA version, added multiple new features, plus a new installer script that automatically resolves all dependencies.
Feature Overview A full list of all new features can be found in the New Features 1.0 Release section.
Code Flow Trace
Shows which basic blocks were executed how many times by approximately 20 different colors
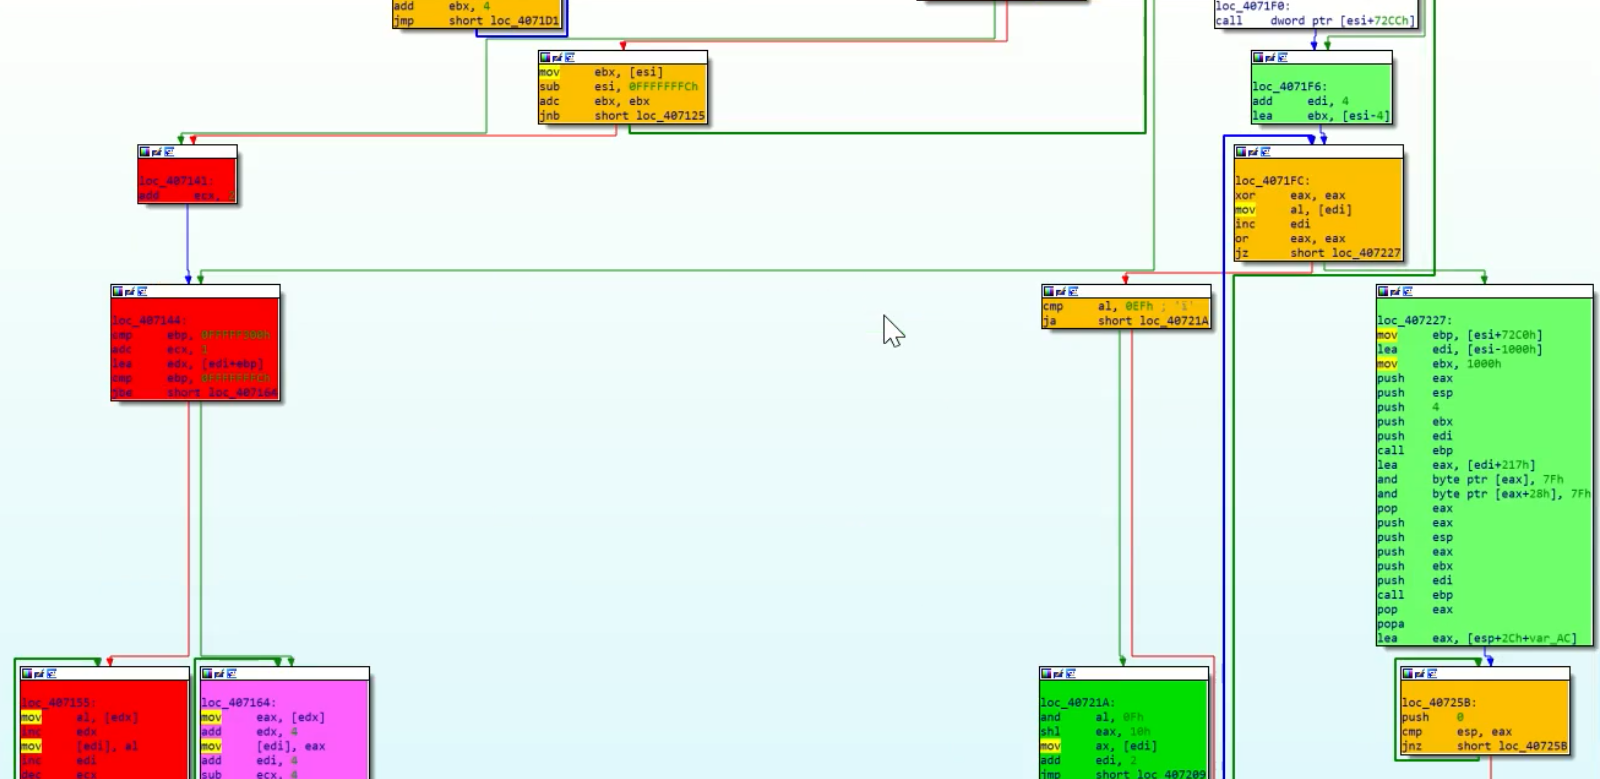
|
| Figure 1 |
Searchable API call logging
This includes all occurrences where certain instructions hit, such as call, jxx, etc. and touch an API address.
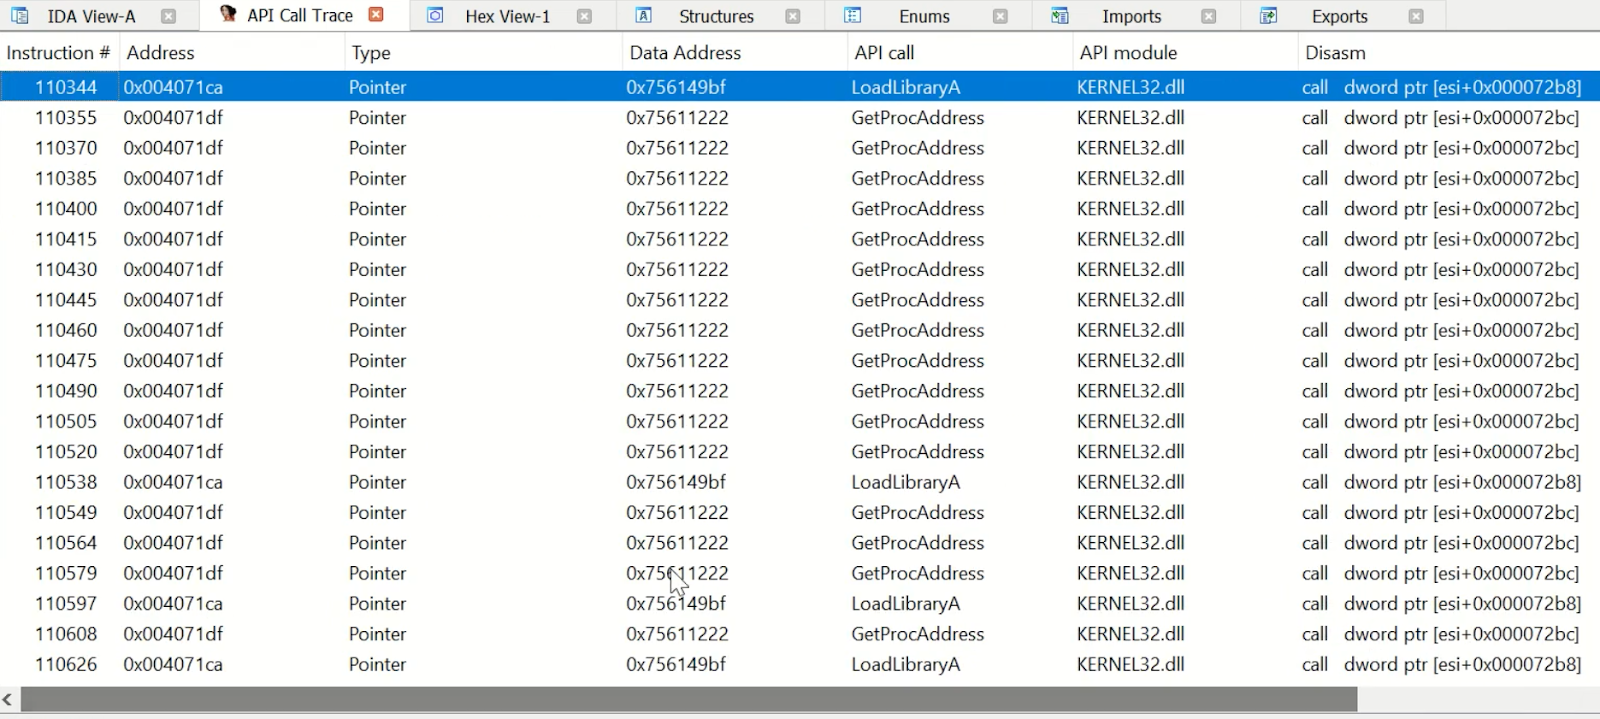
|
| Figure 2 |
Searchable string logging
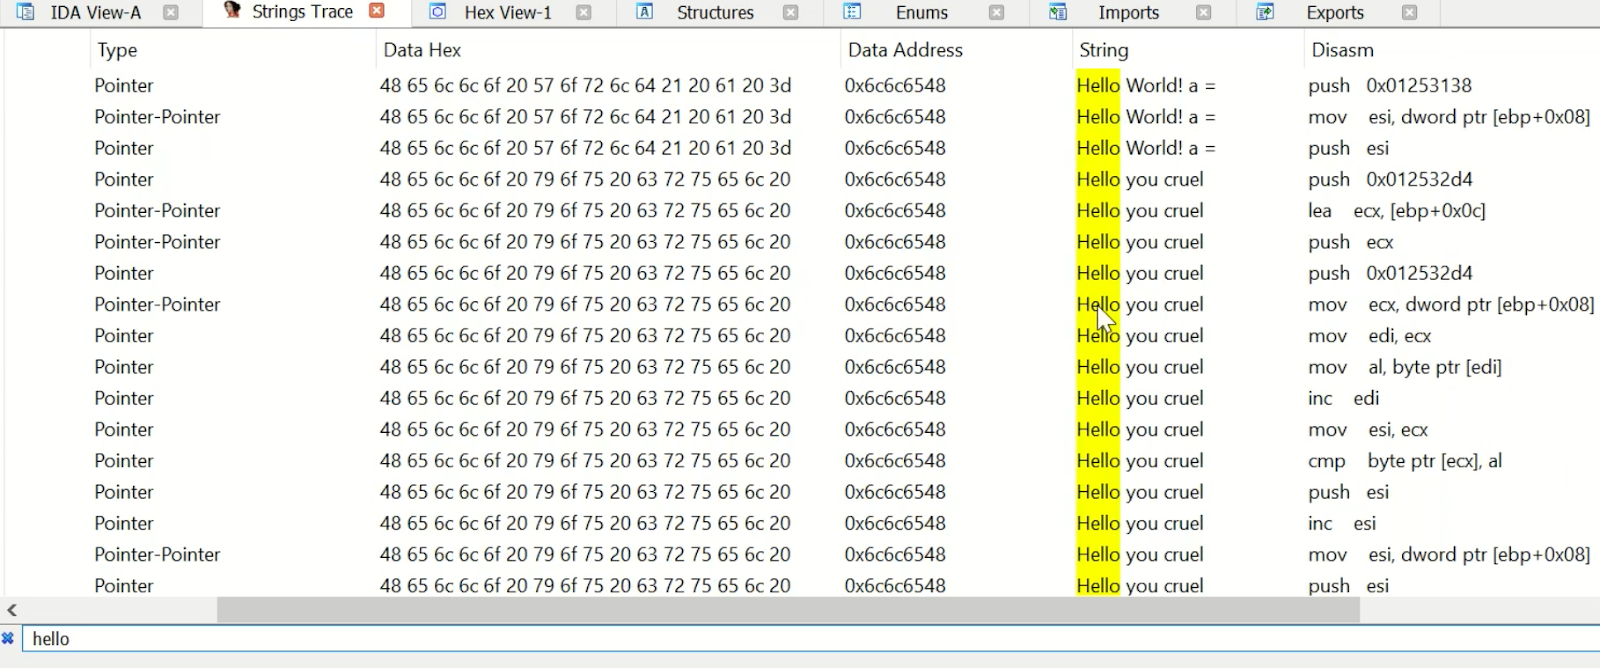
|
| Figure 3 |
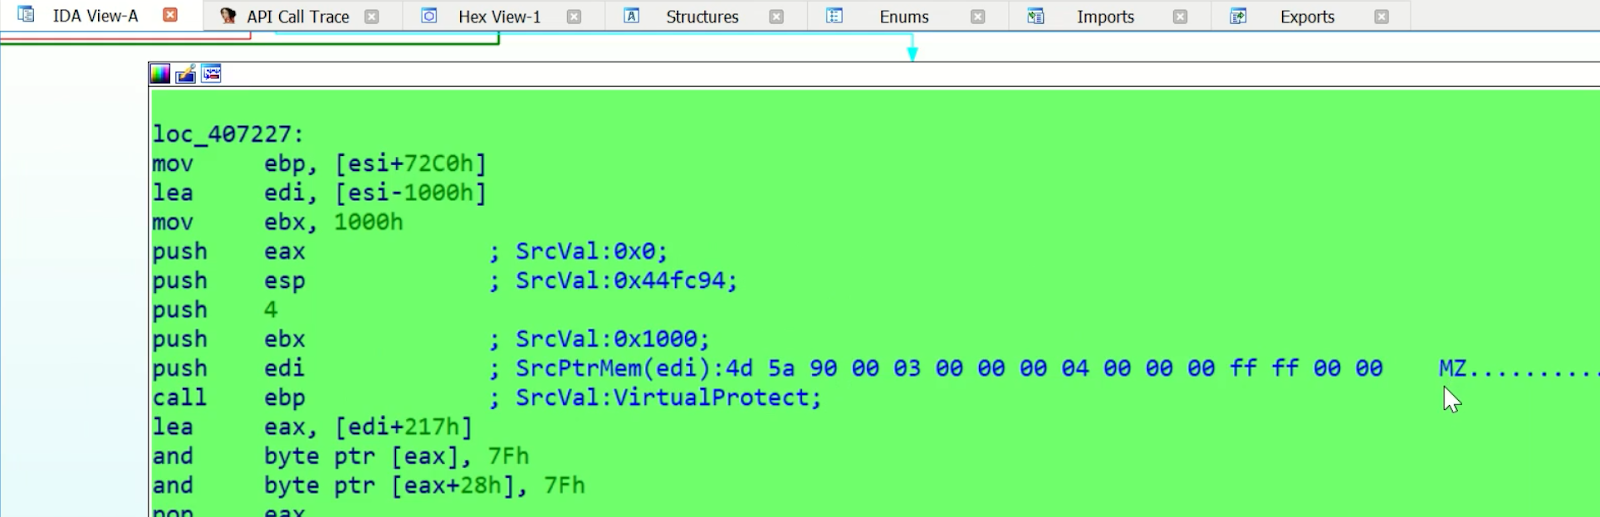
Resolving dynamic values and auto-commenting
|
| Figure 4 |
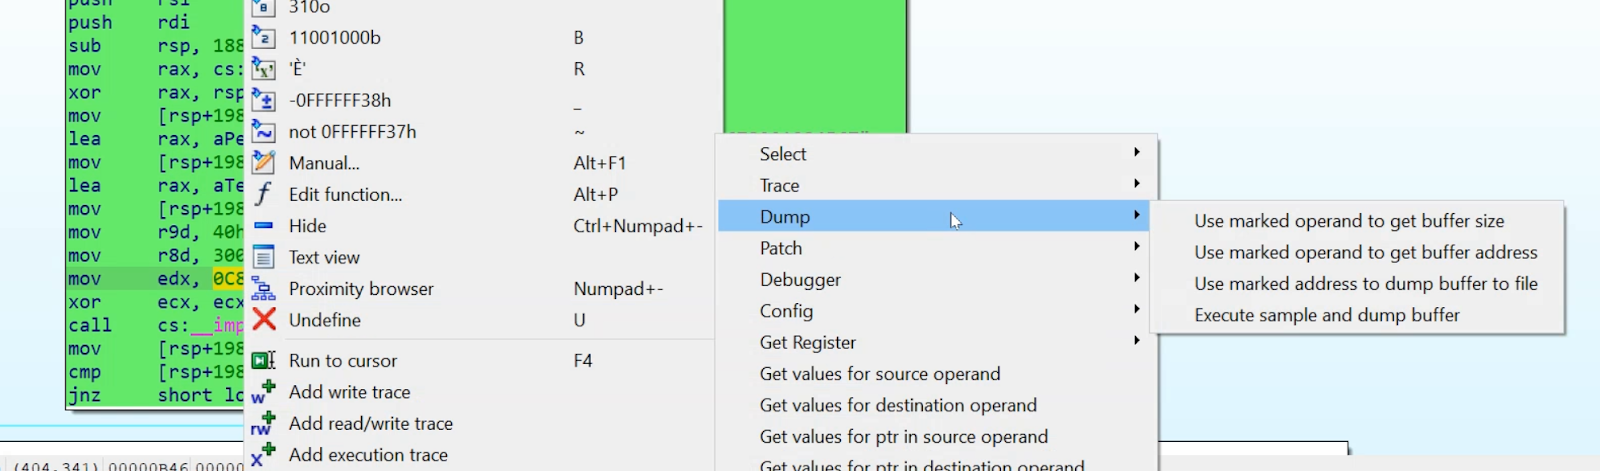
Dumping buffers
|
| Figure 5 |
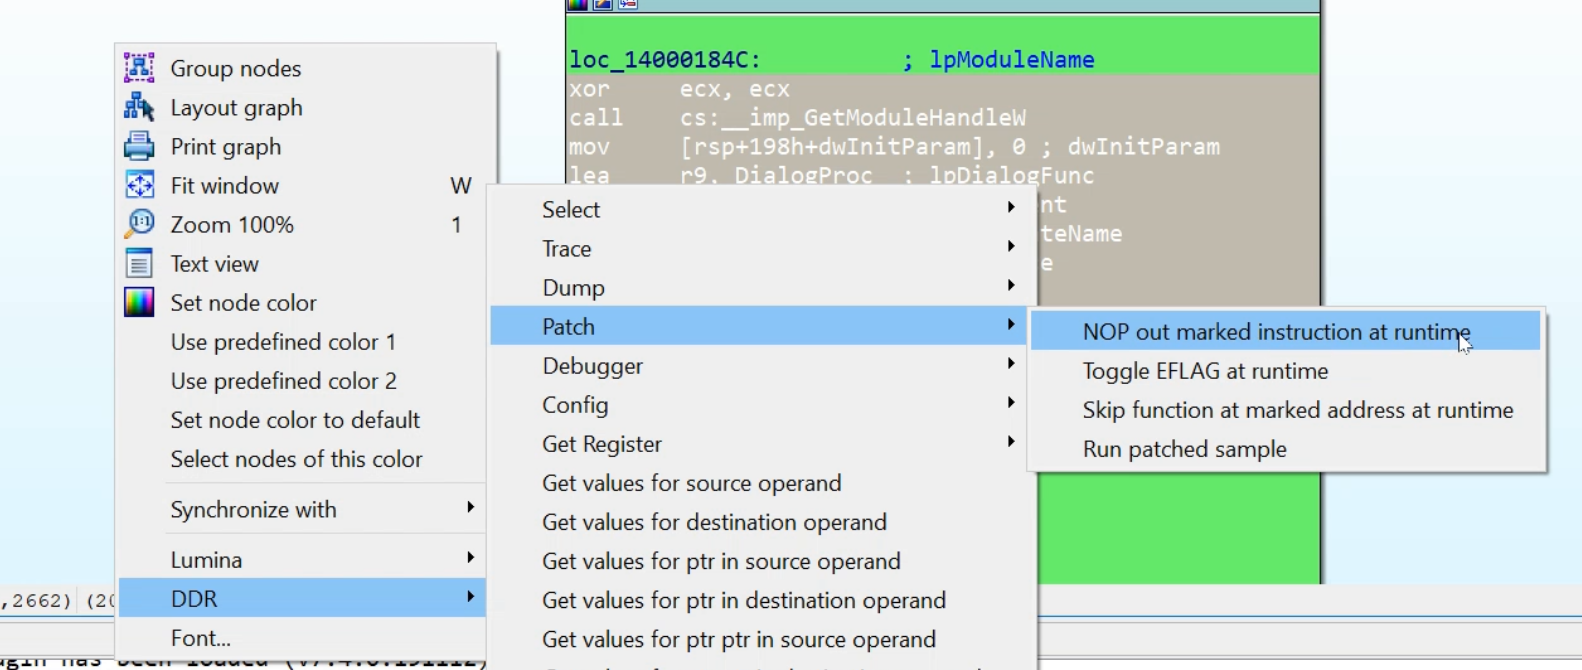
Patching the sample
|
| Figure 6 |
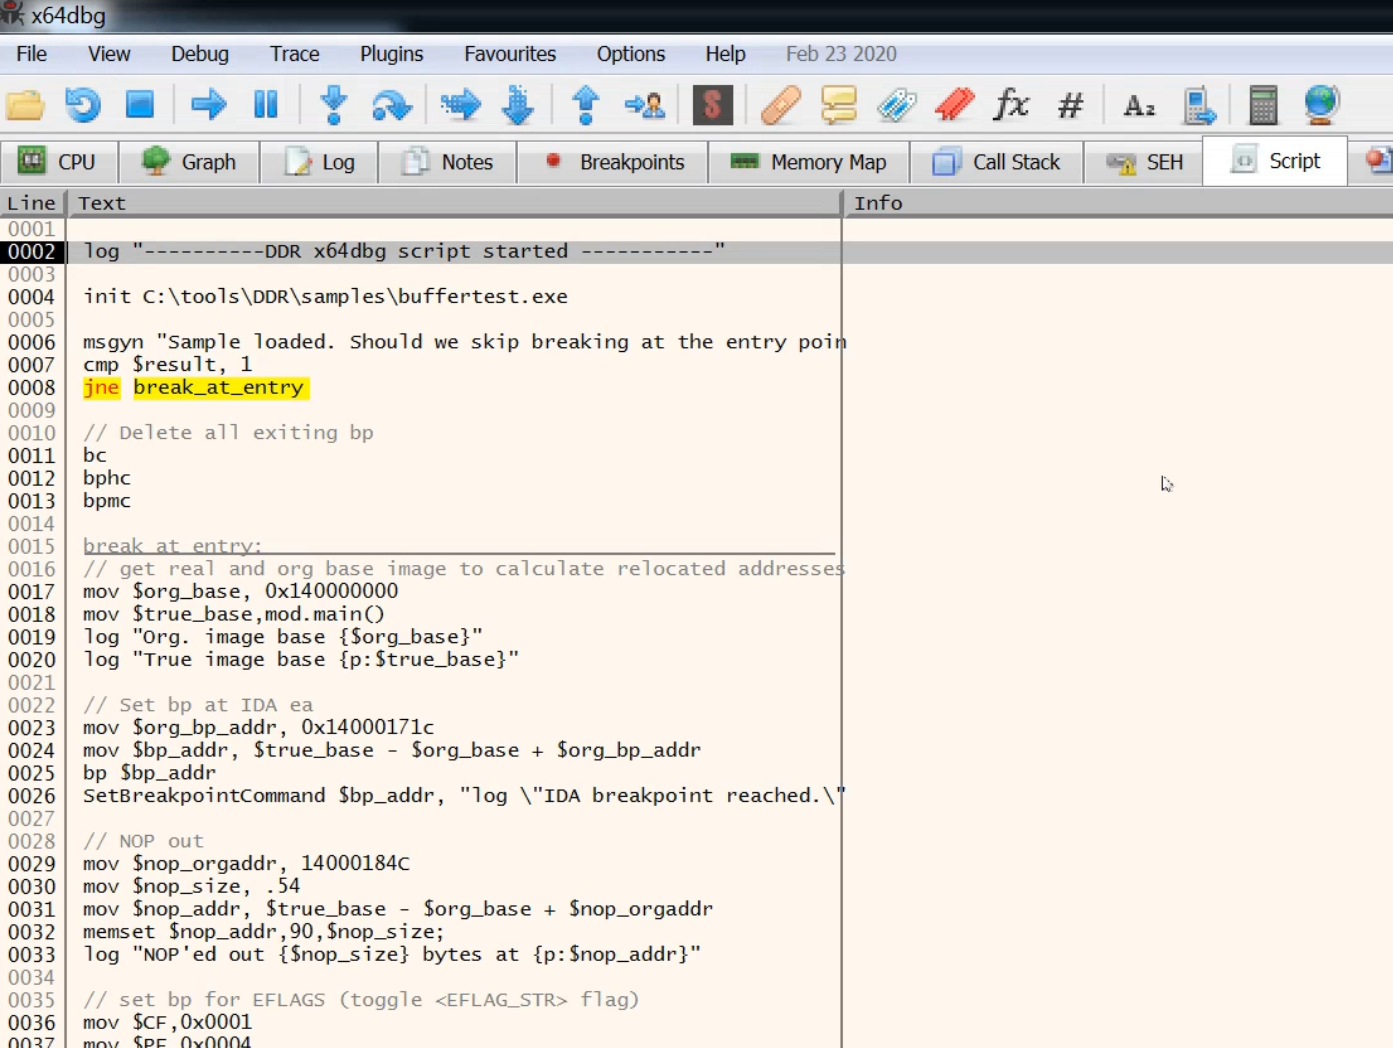
Automatically create Debugger scripts, including patches
|
| Figure 7 |
Installer script
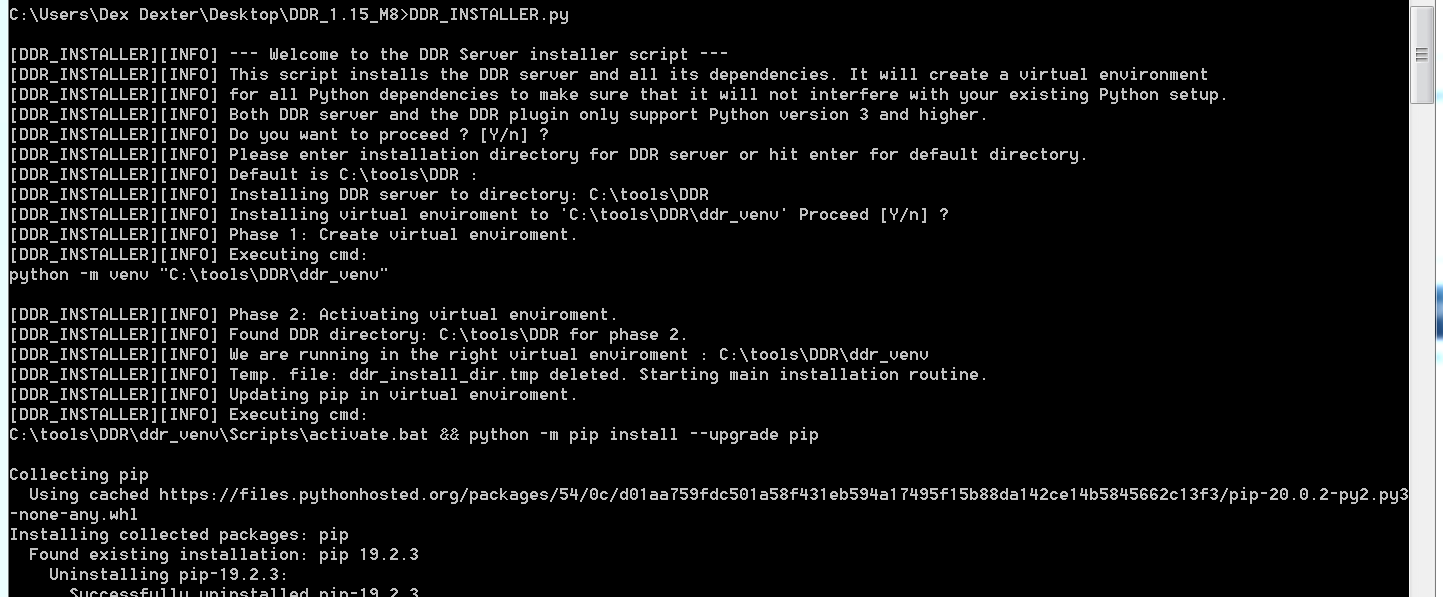
|
| Figure 8 |
Technical Details
Architecture and usage
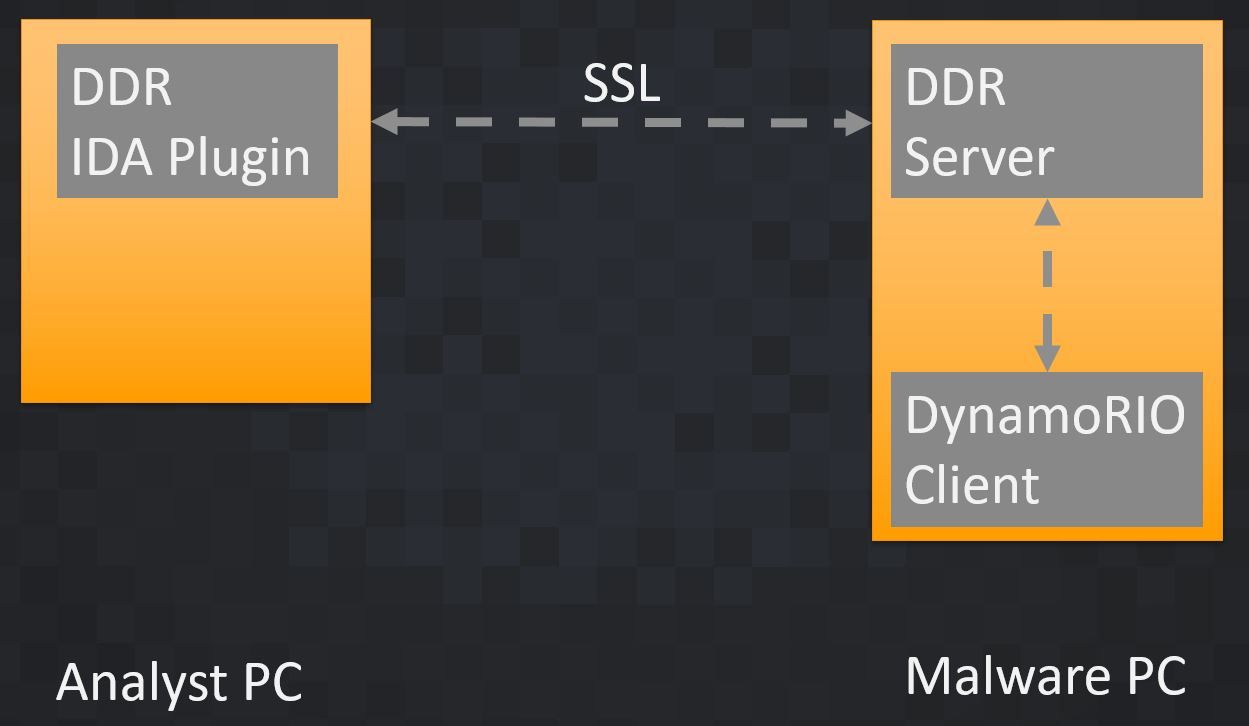
DDR has the client/server architecture shown in Figure 9. The DDR IDA plugin and the DDR server are Python scripts. The DynamoRio client is a DLL written in C, which is executed by the DynamoRIO tool drrun.exe. This DLL is using instrumentation techniques to analyze and monitor the malware sample at runtime. The IDA plugin is the frontend. Usually, all the analysis processes are controlled via the plugin. Once the DynamoRIO client backend is done with the analysis, the result is sent back to the plugin. We picked JSON as the format for this data to make it easier to troubleshoot and to make it easily parsable by third-party Python scripts.
|
| Figure 9 |
Theoretically, you can run the plugin and the server on the same PC, but as far as the malware sample is executed, it is highly recommended to do this on a separate machine.
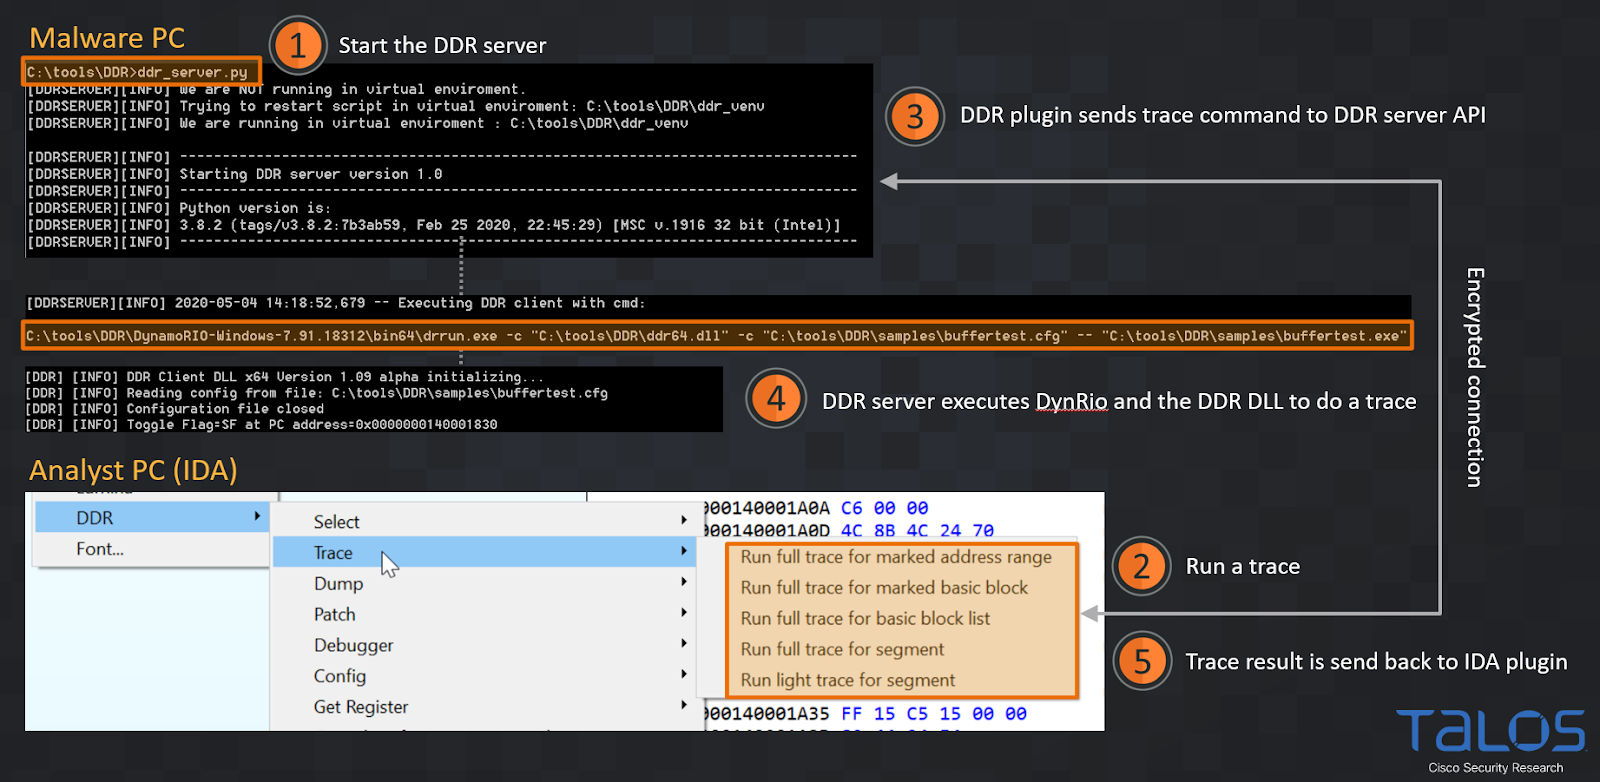
In most circumstances, you can start an analysis to gather dynamic values, from the DDR menu within IDA. Figure 10 and 11 show a common workflow. However, if you want to execute the malware on an air-gapped or Python-free system, you can also do the analysis manually and run the DynamoRio client alone. See the "Special Cases" section below for details. But again, this is usually not necessary.
|
| Figure 10 |
|
| Figure 11 |
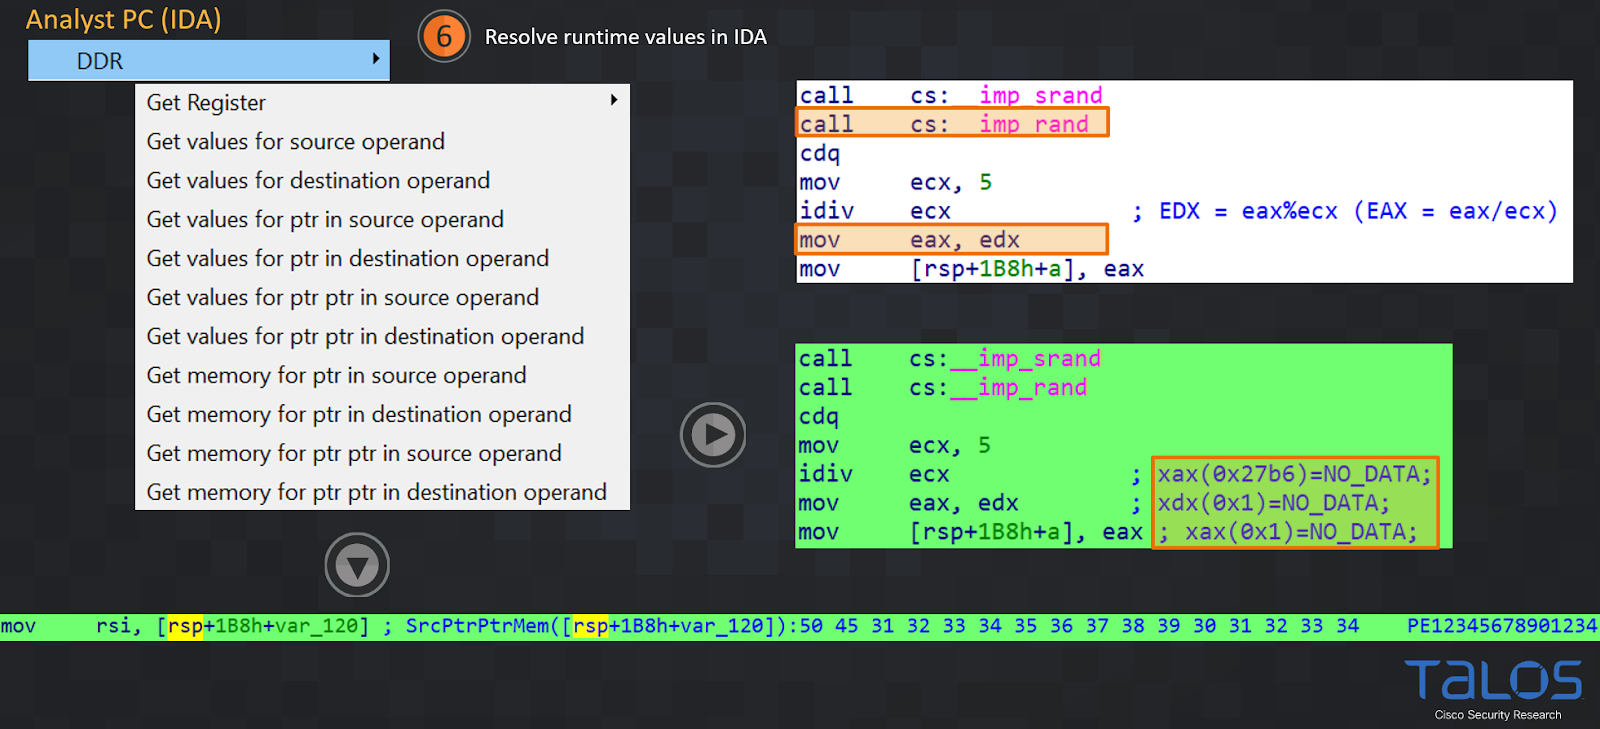
Once you see in the IDA logging output window that the plugin has received the JSON file successfully (point 5 in Figure 10) you can pick one of the "Get value ..." or "Get memory…" menus to resolve a dynamic value for an operand.
Best Practice and important details
Please read this before using DDR.
All features in the DDR plugin are accessed via the right-click context menu in IDAs Disassembler View. Obviously, before you can resolve any dynamic values in IDA, you need to run a trace first or load the JSON file manually. The DDR IDA plugin menu offers several different options for running the trace. They can all be accessed via the Trace menu shown in Figure 12.
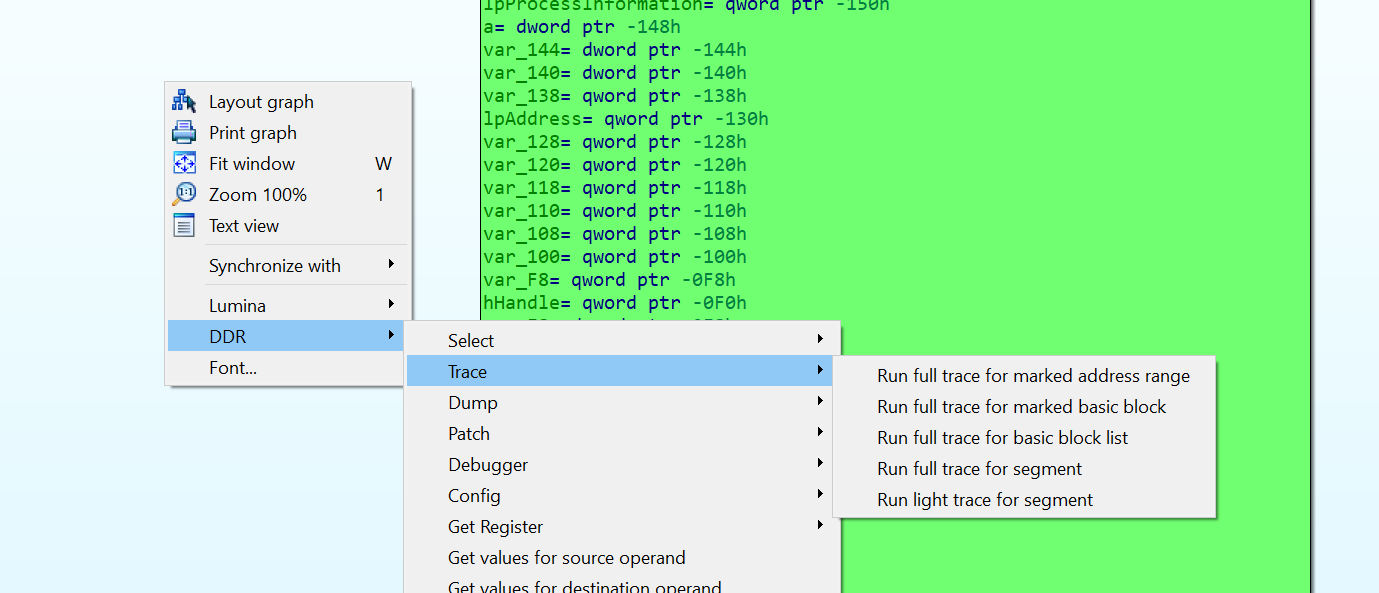
|
| Figure 12 |
The full trace options are collecting far more runtime information than the light trace one. Their execution takes much more time and consumes much more memory than the light trace. The light trace is mainly doing a quick code trace. In other words, it logs the instructions that are executed at runtime, as well as some basic information for control flow related instructions like call, jmp, ret and others. This means you usually want to pick the light trace if you want to execute as many instructions as possible to get an overview of what the sample is doing. For example, to highlight as many basic blocks as possible, based on the number of times they were executed or to get an overview of the API calls touched by the sample.
You can set the maximum number of instructions to trace via the "Config/Set number of instructions to log" menu. The default is 20,000, which works well on an average PC. You are usually running the full traces for cases where you are interested in the details of a function or you are analyzing certain basic blocks, such as a crypto routine, and you need details about all the instructions and it's operands (ex. "Run full trace for basic block list"). The analysis should not take longer than 30 seconds, or you need to increase the API timeout limit in the DDR config menu via "Set number of seconds for API timeout." Alternatively, for larger traces, you can also use the manual analysis as described above. But it is highly recommended to use smaller address ranges or just the few basic blocks you are interested in, to gather this information step by step, instead of changing the time limits and running a very big and long trace. Also, we would recommend skipping sections of large loops to keep the collected data small.
All the DDR value resolution functions are using the JSON file from the last analysis/trace that you have run. For example, if you have just run a light trace and then try to resolve a register value via the "Get Register" menu, you will not find any data because the register data is not gathered in a light trace. It is probably a good idea to check out the generated JSON files when you are using DDR the first time to get an idea about which data is logged depending on the different traces (full/light trace). We would recommend running a full trace for the code area or only the basic block you are interested in.
Other Features
DDR can patch the binary at runtime (Figure 6) using three different methods:
- NOP out instructions.
- Toggle EFLAGs to manipulate code flow decisions like jxx instructions.
- Skip functions and return a custom return value for them.
These patch functions can be used to disable anti-analyzing functions which the sample might use. All of these patches are applied for all menu options, in other words, if you configure certain patches via the Patch menu, they will also be applied if you run a trace or try to dump a buffer (see below).
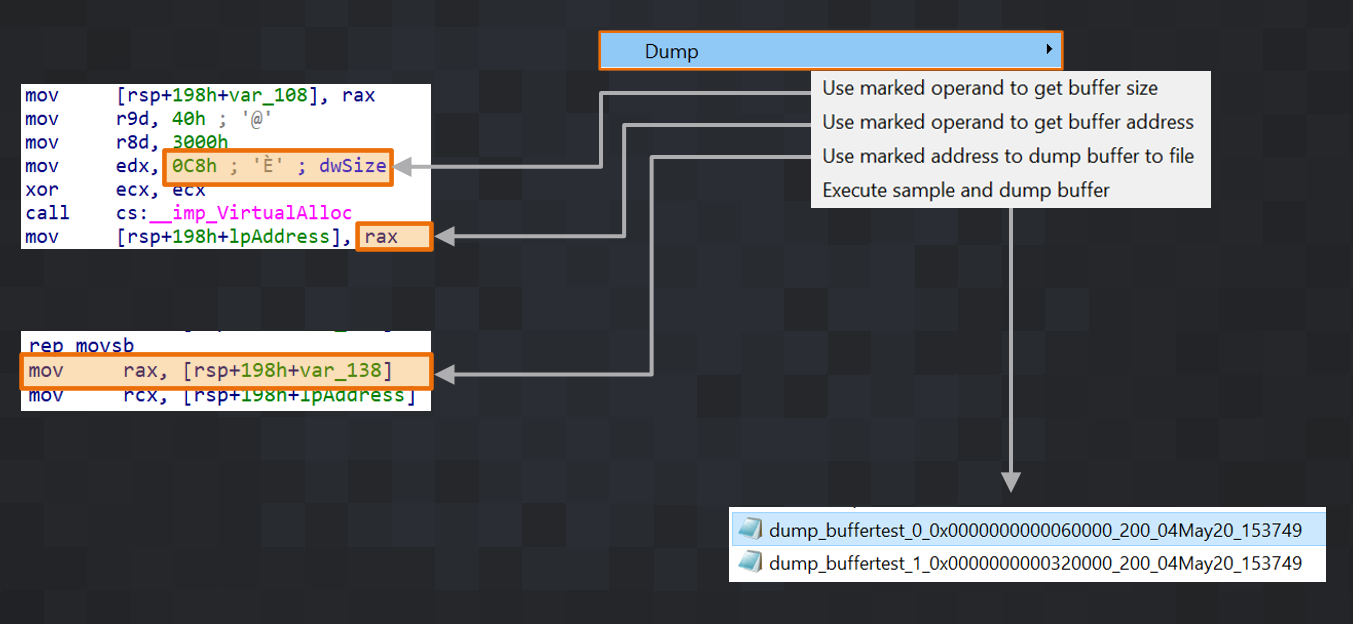
This brings us to the next main feature of DDR: You can dump buffers dynamically. You can mark a certain operand of an instruction to find the size of the buffer you want to dump and DDR will read this value at runtime when the sample is executed. The same applies for the buffer address and the program counter address when you want to dump the buffer. For example, if you have an instruction like 'mov [rsp+198h+var_108], rax' and you know that the buffer size is stored in 'rax', you would mark 'rax' and pick the 'Use marked operand to get buffer size' entry from the 'Dump' menu to select it. Then, you do the same for the operand you think the address is stored in at runtime. Finally, you mark the line in IDA when (at which address) you want to dump the buffer to disk. If all three values are set, you can run the sample and let DDR dump the buffer. After dumping it to disk, it will automatically be copied to your IDA machine and you can save it somewhere. Another example of dumping a buffer allocated by VirtualAlloc is shown in Figure 13.
|
| Figure 13 |
The debugger menu includes features that help you to work with external tools on the sample. You can either generate an x64dbg script which includes all the patches you have configured or a patched version of the sample file with an endless loop at the highlighted program counter address. With the latter, you can run the sample and attach your preferred debugger to it. The DDR server output window shows you the original bytes which were overwritten with the endless loop, so you can easily reconstruct them in your debugger.
This video below shows you the different DDR features and some of the described workflows.
It is highly recommended that you first run DDR with the test samples, which can be found in the 'ddr_installer\ddr_test_samples' directory. Make sure you first get familiar with how DDR works before running real malware with it.
These test samples also trigger certain special cases e.g. multi-child-processes and threads. See the README file in the 'test_samples' directory for more details.
Special cases — Air-gapped analysis (optional)
As mentioned above, the DDR DynamoRio client DLL can also be directly executed on the command line. Due to the new features, we moved to a central configuration file, instead of command-line arguments in the former version. You can check the ddr_server.py logging output after you executed a DDR command from within IDA to get an idea of the syntax. It looks like:
<DYNAMORIO_INSTALL_PATH>\bin64\drrun.exe -c "<DDR_INSTALL_PATH>\ddr64.dll" -c "<DDR_INSTALL_PATH>\samples\<SAMPLE_NAME>.cfg" -- "<DDR_INSTALL_PATH>\samples\buffertest.exe"
The <SAMPLE_NAME>.cfg file is the file where all DDR client configurations are stored in. You will also find a commented sample_config.cfg configuration file in the docs directory. When you run a command from within IDA, the ddr_server.py script stores the CFG file in the samples directory as you can see above (default location is C:\tools\ddr\samples). Reading it should give you an idea for the different use cases.
After the analysis is done, you will need to load the produced JSON file via the "File/Load file/Load DDR trace file" menu into IDA. See the Caveats section for more details.
Installation
First, install Python 3 on the "Malware PC" shown in Figure 9 and make sure that IDA on the "Analyst PC" is using a Python 3 setup, too. DDR does not support Python 2. Then, download the DDR repository or installer zip archive from here. Please also see the recommended environment below.
Due to a bug in earlier versions of IDA, if you want to run the DDR plugin in IDA < 7.5 you should install Python 3.7 on the IDA machine. The DDR server side can still be Python 3.8 or 3.7.
Extract that archive on the "Malware PC" shown in figure 9. Finally, execute the DDR_INSTALLER.py script from the archives root directory (Figure 8). This script will not touch your existing Python environment, it will create a dedicated virtual Python environment for DDR. It also comes without any non-standard Python module dependencies. All dependencies are downloaded by the script at runtime. It will also install the DynamoRio Framework to your DDR installation directory. The script will guide you through the whole installation process of both the DDR server and the DDR IDA plugin. Read the output of the script carefully, it contains many further hints which are important for the installation. You can find a video of a full walkthrough of the installation process in the DDR github 'ddr_installer\docs' directory.
Caveats
Microsoft Windows command prompt issue
The Microsoft Windows command prompt freezes Python applications if you mark any text inside of the command prompt window. This beta version of DDR is writing most of the logging messages to the standard output of the CMD window along with the log file. This means if you mark any of DDR's output in this window, the DDR server will pause. In other words, it will not process any additional commands until you either hit ESCAPE or copy the marked text. If you are running into timeout errors while using the plugin, it is likely that you accidentally marked something and forget to release it. If this happens, move to the DDR server window and hit ESCAPE a couple of times or just restart the server. Then you can test the communication by pointing your browser on the IDA machine to the root directory of the server on the port you configured during the installation. For example: https://<DDR_SERVER_IP>:<DDR_SERVER_PORT>.
Multitasking and child processes
DDR supports processes which are starting multiple threads and child processes. This is a relatively new feature in this beta version, so the DDR client DLL still prints out a warning message. You can find some multithreading/multiprocess test samples in the DDR installation ZIP archive.
Everytime DDR gets executed, it creates a "ddr_processtrace.txt" file (see sample directory on the IDA machine) which content looks like this:
testsample2_64.exe [2596]
write.exe [3600]
wordpad.exe [3864]
EvIlMaLwArE.exe [1368]
notepad.exe [2296]
The first string is the process name which was started, the number in brackets is the PID. For any child process DDR generates a separate threads file like "ddr_threads_EvIlMaLwArE.exe_1368.txt". This file contains all threads this process has started. The content looks like this.
EvIlMaLwArE.exe [1368] [3852]
EvIlMaLwArE.exe [1368] [2552]
EvIlMaLwArE.exe [1368] [940]
EvIlMaLwArE.exe [1368] [3816]
It means the process 1368 has started one main thread and three additional threads.
DDR also creates separate IDA JSON trace files if you do an instruction trace (Menu shown in Figure 12). For example:
trace_tmp_B4AB561A5A8A53E262C3D09738FFBFA3_EvIlMaLwArE.exe_1368.json
trace_tmp_B4AB561A5A8A53E262C3D09738FFBFA3_EvIlMaLwArE.exe_1368_apicalls.json
This is handy if you are analysing a sample which is just starting another instance of itself, like the testsample2.exe is doing. You can use the "Load DDR trace file" and "Load DDR trace API file" buttons or the 'File/Load File/Load DDR…' menu to load these JSON files into IDA. You only need to load the "..._apicalls.json" file if you want to resolve the API calls, too.
The only caveat with this is, if a 32-bit process is launching a 64-bit child process, DynamoRIO has not implemented this scenario yet and DDR is missing the 64-bit process(es). It will not see it, so it will not create the above mentioned files for it and it will not kill these processes at the end of an analysis, like it is usually doing for all processes which were started by the sample at runtime. Even if DDR tries to clean up and kill all processes of the sample at the end, it is recommended not to rely on it. It is best practise to check separately, if there are any missed malware processes running on the malware machine before proceeding. It is always possible that the malware found a clever way to start a hidden process and DDR missed it.
DDR client crash notice
Sometimes, if you quick and dirty patch a sample you might create unstable conditions. For example, you NOP out the initialization of a register which is used later in the code which leads to a crash and you get the DDR client crash notice message box on the DDR Server. Figure 14 shows an example.

|
| Figure 14 |
Of course that will also make the DDR plugin operation fail which initiated the operation e.g. dump buffer. So either you analyze why the application crashed or you just try it again, with a bit of luck the register is filled with a different random value and the crash does not occur again. Of course, the latter is not the most elegant way, but often works. If the crash still occurs and you are sure that it is not caused by your patch, it is likely a DDR client issue. Please open a bug in this case.
Recommended environment
All internal tests are run on this setup.
Analyst PC:
VMware Workstation VM
Windows 10 Enterprise 64bit
Version 1909
RAM: 2GB RAM
Python 3.8
IDA Pro 7.5
Malware PC:
VMware Workstation VM
Windows 7 Professional 64bit SP1
Version: 7601
RAM: 2GB
Python 3.8
Default installation directory: C:\tools\ddr
New features in 1.0 release
- Automatically copy sample file from IDA to DDR server-side
- Python 3 support
- IDA 7.4+ support
- Installer with virtual environment support
- Dumping buffers at run time
- Patch sample:
- NOP out instructions at run time
- Toggle EFLAGS at run time
- Skip Functions and return custom return value
- All patches are also applied for other features, such as dumping a buffer
or running a trace. - Automatic creation of debugger scripts to execute samples in an external debugger (including the selected patches).
- Creation of a sample patched with an endless loop to allow attaching an external debugger to it.
- Select multiple building blocks to run full trace.
- All configurations are moved to JSON files.
- Improve input checks for user-provided data.
- Moved to new JSON API for DDR server.
- Import instruction and API trace files
- Multi-process and thread support
- Moved to FastAPI from Flask
- Code cleanups and improved code structure
It is still hackish code, don't use it as coding style best practice ;)