Part 1 - Unpacking the binary to properly view it in IDA Pro
Recently, I came across an executable(MD5: 3D5060066056369B3449606F3E87F777) that was expected to be malicious in nature, but its network behavior was what was really interesting. So the first thing I did was throw it into a Virtual Machine. Running Wireshark, I immediately noticed several DNS queries per second to what appeared to be "random" domain names (I have modified my DNS settings so all domains are giving a response):
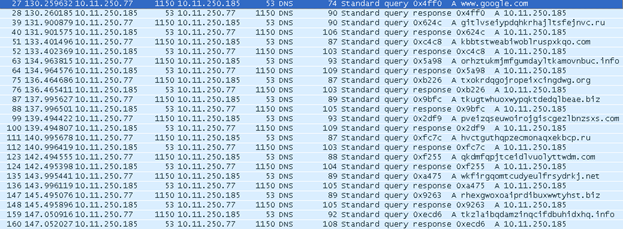
If you are familiar with malware, this is typical of a piece that uses an algorithm to generate domain names to call out to. If we want to block these domains in the future, we must reverse the process of generating these names and implement our own version.
But how does this work? What process is doing it? Is it using the WS2_32 library? WinINet? Maybe RPC functions in other executables? I use a great tool called API Monitor to quickly tell what libraries are being used within an unknown binary. For this case, I'm using it specifically to learn what functions the malware uses to call out or receive data. Shortly after using API Monitor, it becomes clear that it is actually Explorer.exe calling out to the internet using WinINet functions:

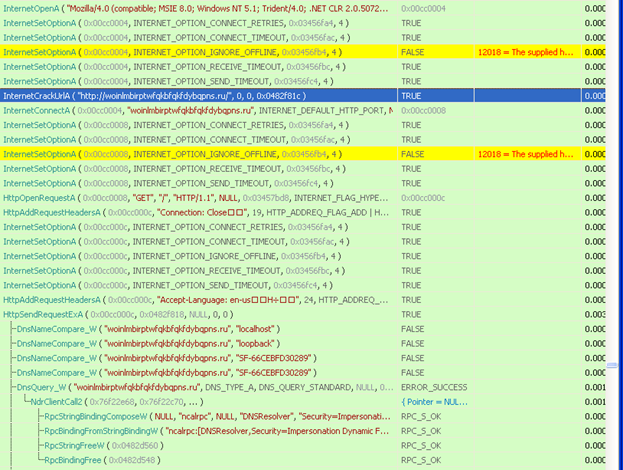
So we must figure out how these likely malicious instructions are injected into Explorer and then what the algorithm it uses to generate domains is. I will try to be brief about the other functionality of the malware so that I can focus more finding and decoding the DGA algorithm itself.
Unpacking the Child Executable (general overview)
(TLDR, just dump it with your favorite debugger/dumping program(s) and move to the next section if you want)
When the malware is executed, it drops another executable on disk with a “random” name and executes it. For example, mine was called:
C:\Documents and Settings\User\Application Data\Eqebu\eptixo.exe
(MD5: 577A7717AFE10AA03B07C6433AEC1845)
To figure out what it does, we need to unpack it for analysis (assuming that it is packed).
Though PEiD says it’s not packed:
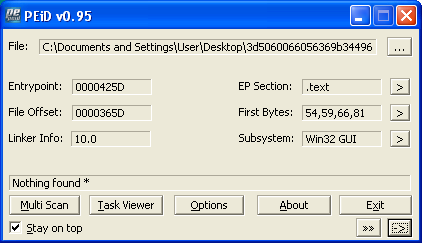
Opening it in IDA shows us something different:
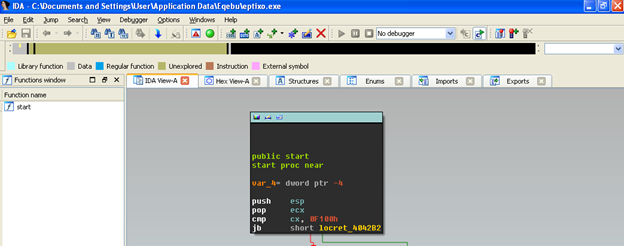
Look at all that tan (unexplored space) in the navigation band. No Bueno. This is a key indicator that this executable is packed. So let’s unpack this thing.
If we open it in Ollydbg (I use Ollydbg 2 later, I only had the OllyDump plugin for version 1 at the time) or your favorite debugger/dumping program, we can just step until we see a ‘PUSHAD’ instruction. Looking around this instruction shows us the decoding loop:
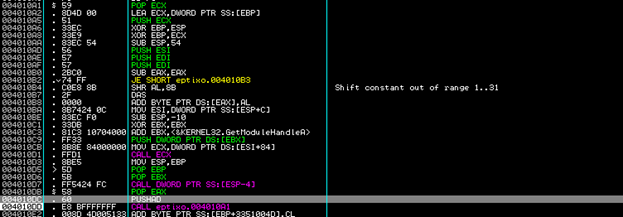
If we enter the function called by:
004010D1 . FFD1 CALL ECX ;eptixo.0040770A
We see that memory is allocated at the call to 0x407DBE:

and written to:
Memory map, item 16
Address=00370000
Size=00001000 (4096.)
Owner= 00370000 (itself)
Section=
Type=Priv 00021040
Access=RWE
Initial access=RWE
Data is then copied over to that newly allocated area of memory (another typical unpacking technique), and we actually end up returning to it:

The binary reads in more data from itself using ReadFile. Nothing will execute in the main memory segment until the file is finished unpacking.

A few instructions later, we see a call to VirtualProtect(), setting our main executables memory permissions to PAGE_READWRITE. Then, another REP MOV instruction is encountered (used to move bytes until ECX is 0), followed by another call to VirtualProtect() setting memory access back to PAGE_EXECUTE_READ. (Note: You can sometimes just set the main section to READONLY but DEP will cause an access violation if it gets executed)
- VirtualProtect() -> Set original memory segment to PAGE_READWRITE
- Move data from unpacked section to original memory segment
- VirtualProtect() -> Set original memory segment back to PAGE_EXECUTE_READ
This usually means that we are going to be modifying our binary (unpack data into), so the binary needed to set permissions to write over these areas in memory, unpack itself, and then reset those permissions back.

We see this again a few more steps later. Note the PUSHAD/POPAD instructions surrounded by a loopd instruction, this is yet another signature of code being packed/unpacked. Usually an unpacker will save all of the registers before unpacking and then restore them to their original state afterwards.
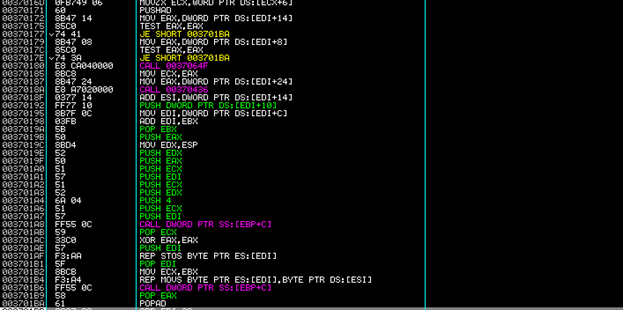
Still further down we see:

This instruction is placing the value 0x000253C3 into ESI then adding it to EDI, which points to the base address of our current executable (0x400000). ESI will then contain 0x004253C3. This address is eventually placed on the stack and returned to. This is the first time an instruction has been executed in the original memory address since entering the allocated range. This is the "OEP" (Original Entry Point). This executable is now unpacked. But now you have to somehow write it to disk.
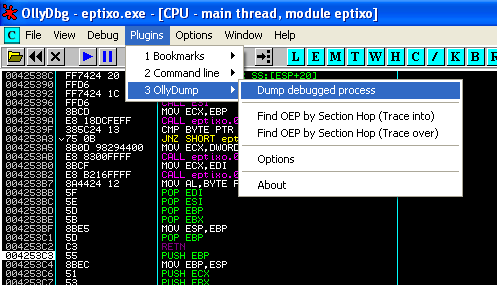
To dump it, there is a useful OllyDbg plugin called:
OllyDump (http://www.openrce.org/downloads/details/108/OllyDump)
and a tool called:
ImpRec (http://www.woodmann.com/collaborative/tools/index.php/ImpREC).
Just make sure EIP is pointed to OEP 0x004253C3.
1. Go to Plugins -> OllyDump -> Dump Debugged Process
2. Uncheck “Rebuild Import”
3. Click “Dump” and save it on disk somewhere
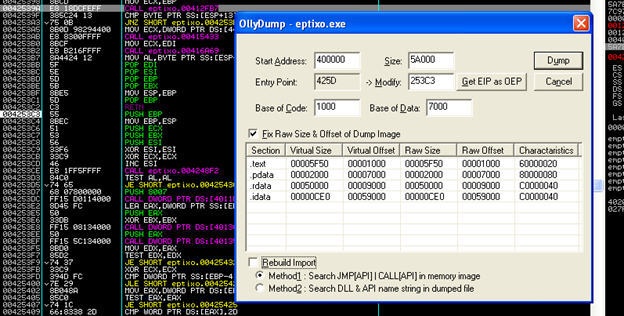
Now open ImpRec
1. Open the saved dump file in ImpRec
2. Under “Attach to an Active Process”, select the currently-debugged child process you just dumped this executable from.
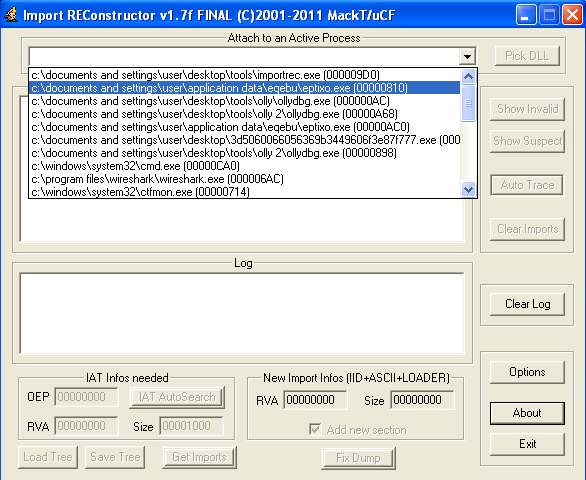
3. Enter 253C3 in the “OEP” field (Remember 004253C3?). This is the offset of the OEP from 400000 in the file.
4. Click “IAT AutoSearch”. It should say that it may have found the Original IAT (Import Address Table).
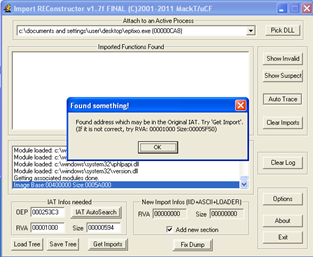
6. Click “Fix Dump”, select the binary you are currently working on and click “Open”.
7. It should save it as the same name as the selected binary with an underscore at the end. It is now dumped!
Check it out in IDA now… Much better!
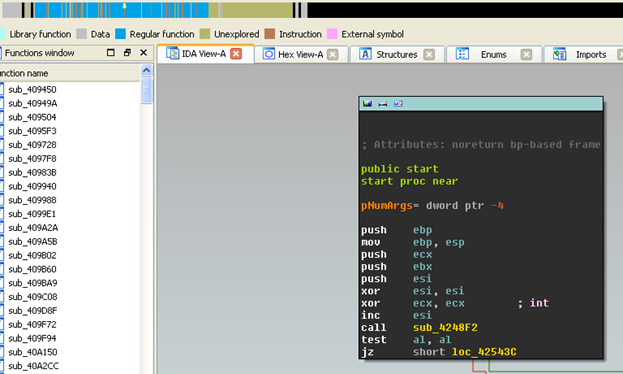
Clearly, there is some more information in the tan area that will probably be used later. However, now that the executable is dumped, it is much easier to get an idea of what is going on with the use of this static data combined with dynamic analysis.
In the next post, I will go into catching the injection into the explorer process and landing at the entry point. Thanks for reading!
