Last week, I talked about unpacking this binary for static analysis. This week, I am going to talk about catching its injected entry point inside explorer.exe. This makes it easier to dynamically analyze the code from the very beginning of its execution routine up to the code utilizing the DGA algorithm.
There are several approaches into injecting code into other executables. One method is to drop a dll and load it in the target executable via LoadLibrary. However, this sample injects code straight into memory without requiring the use of the LoadLibrary function. This can be more complicated, but that is how they implemented it.
The basic steps are:
1.Use OpenProcess or CreateProcess to get the handle of the target process
04340DC call ds:OpenProcess
2.Use VirtualAllocEx to allocate space into the target process
00424188 call ds:VirtualAllocEx
3.Use WriteProcessMemory to write our code into the target process
004241C7 call ds:WriteProcessMemory
4.Use CreateRemoteThread to execute code within the target process
00434132 call ds:CreateThread This sample injects itself into every process in the process list, except for itself. Depending on which process it is injected into, it will perform different functionality.
So How Can We Get to the Entry Point of our Process in Explorer?
The problem is that we need to catch the code paused at the entry point in explorer. If it only injected into one process, this could be easy. There are a few ways to catch it if that were the case:
- Set the Just-in-time Debugger to Olly and throw a CC at the entry point of the code. This would make the program crash to the debugger that I have specified, catching the program at the
EP(Entry Point). The problem here is that every process on the system would crash and cause Olly to go nuts trying to debug every process at once.
- Throw an ‘
EB FE’ instruction at the EP section of code to be injected. This would cause it to infinitely loop until I attached to the process.
The problem here is that every process on the system would infinitely loop, making Windows sad.
So I took a slightly different approach that went something like this:
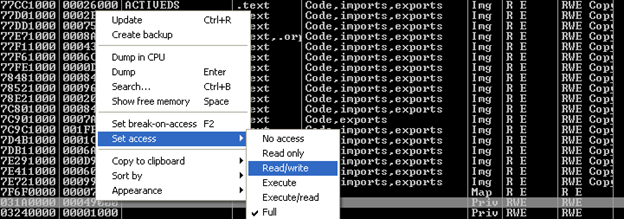
- Attach to explorer.exe, view memory map, sort by access, run as usual

- Set a breakpoint on
CreateRemoteThreadin the calling process (the child):0x4241C7 - Hit F9 (run) until I see a newly-allocated memory region in explorer.exe with RWE permissions.
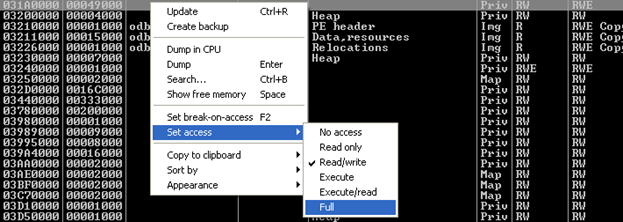
WriteProcessMemory()will occur between now and CreateThread. (You may have to pause explorer.exe to allow the memory map to refresh, as well as run to this bp a few times before memory is correctly written to this segment): - Set permissions to R/W only at the newly-created segment:

- Run the calling process to call CreateThread->CreateRemoteThread targeting explorer.exe
00434132 call ds:CreateThread- Which calls:
004340BC call ds:CreateRemoteThread indirectly

- Check explorer.exe. Bingo, we are now at the entry point of the malicious code inside of explorer.exe!

- Remember to reset permissions :)

We now can debug the DGA functionality injected into explorer.exe! Check in soon for part 3 of this blog series where I will decode and rewrite the algorithm for detection.
