Authored by Aleksandar Nikolic.
Executive summary
It can be very time-consuming to determine if a bug is exploitable or not. In this post, we’ll show how to decide if a vulnerability is exploitable by tracing back along the path of execution that led to a crash. In this case, we are using the Tetrane REVEN reverse-engineering platform, which allows us to identify the exploitability of the bug quickly.
Probing for software vulnerabilities through fuzzing tends to lead to the identification of many NULL-pointer dereference crashes. Fuzzing involves taking various permutations of data and feeding those permutations to a target program until one of those permutations reveals a vulnerability. The kinds of software bugs we reveal with fuzzing may be denial-of-service vulnerabilities that aren’t particularly critical and simply cause the software under test to crash. However, they could also be evidence of an arbitrary code execution vulnerability where the NULL pointer can be controlled, leading to the execution of code supplied by an attacker. Below, we will sort through all of this and determine whether a particular flaw is exploitable or not.
The crash
If you are looking for vulnerabilities every day, you get to look at a lot of fuzzing results. Frequently, you end up with a bunch of NULL-pointer dereference crashes which are, for most intents and purposes, useless. Then, every once in a while, a crash like this comes by:
Windbg output at time of crash
Such discoveries are exciting and annoying at the same time. It looks like a NULL-pointer dereference since it’s crashing due to a read-access violation on the NULL address, but it’s so close to that ‘call’; if we could get `ecx` under control, it’s a straight jump to arbitrary code of our choosing. But, 99 percent of the time, this is really just a NULL-pointer dereference.
In some cases, these are easy to confirm as really being NULL-pointer dereferences — a field in an object is explicitly initialized to NULL and was never assigned a valid value, and the access is direct and not with offset. In other cases, there can be a lot of code executed between the time the field is initialized and the time of the crash. The value can be copied, pushed and popped off the stack and so on, masking the original source. This is where time-traveling debugging is helpful.
REVEN allows us to record every single instruction executed in a virtual machine (VM) during a certain period, simulate it and analyze everything statically at any point of execution with a complete view of the machine’s state. This will help us confirm the exploitability, or rather non-exploitability, of this crash.
Locating the crash
First, we must locate the crash event. On Windows, when a process crashes due to an access violation, execution is transferred to `KiUserExceptionDispatcher`. So we can search our complete trace for calls to `KiUserExceptionDispatcher`:
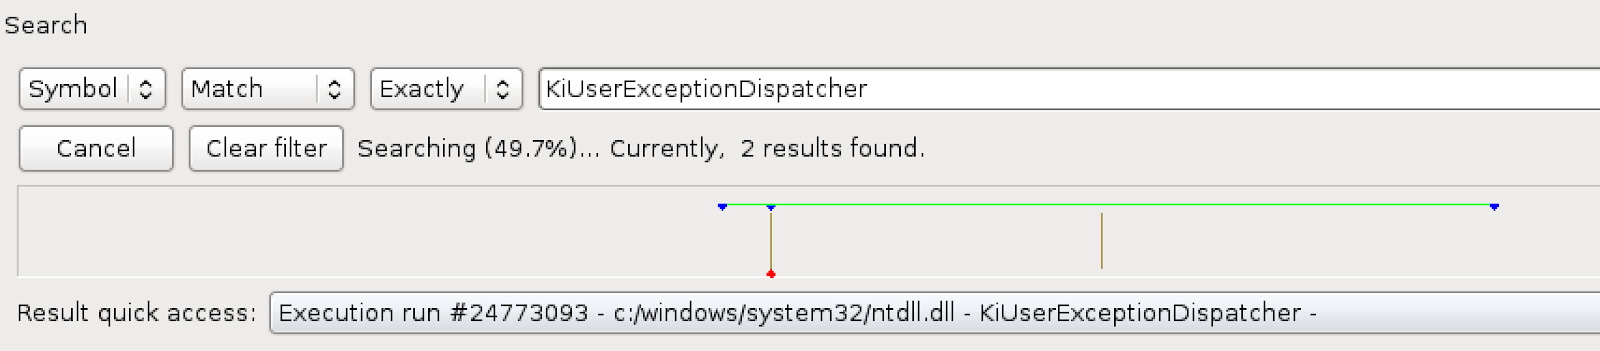
Even though the search isn’t finished, we can see two calls to `KiUserExceptionDispatcher`. If we go to the first one and view the stack, we can see:
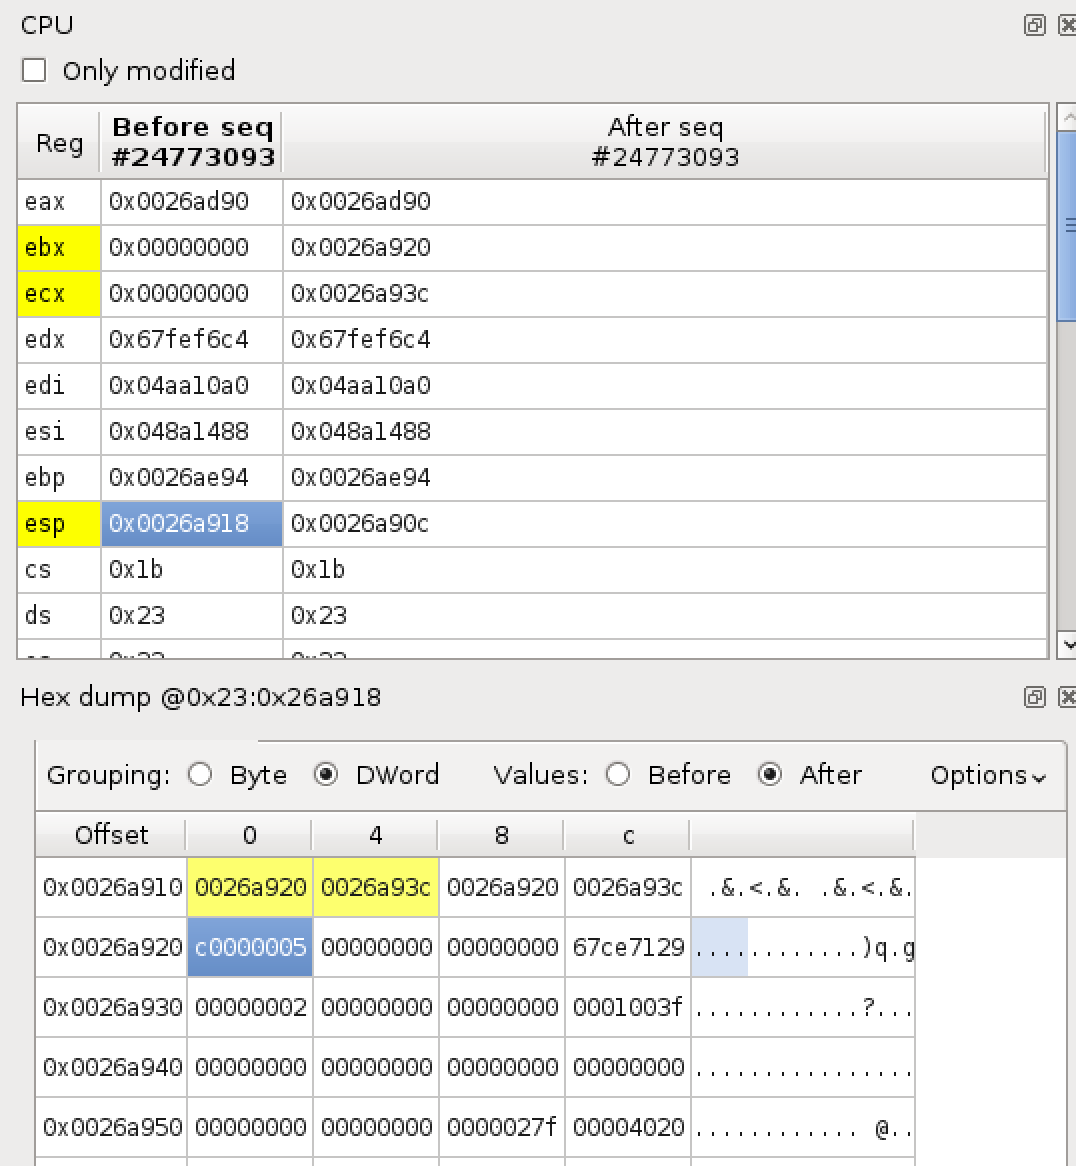
On the stack, we can see the value 0xc0000005, which is an exception code for ACCESS_VIOLATION, that is passed as an argument to `KiUserExceptionDispatcher` . So, it appears we are in the correct place. And indeed, one sequence prior to `KiUserExceptionDispatcher` we see:
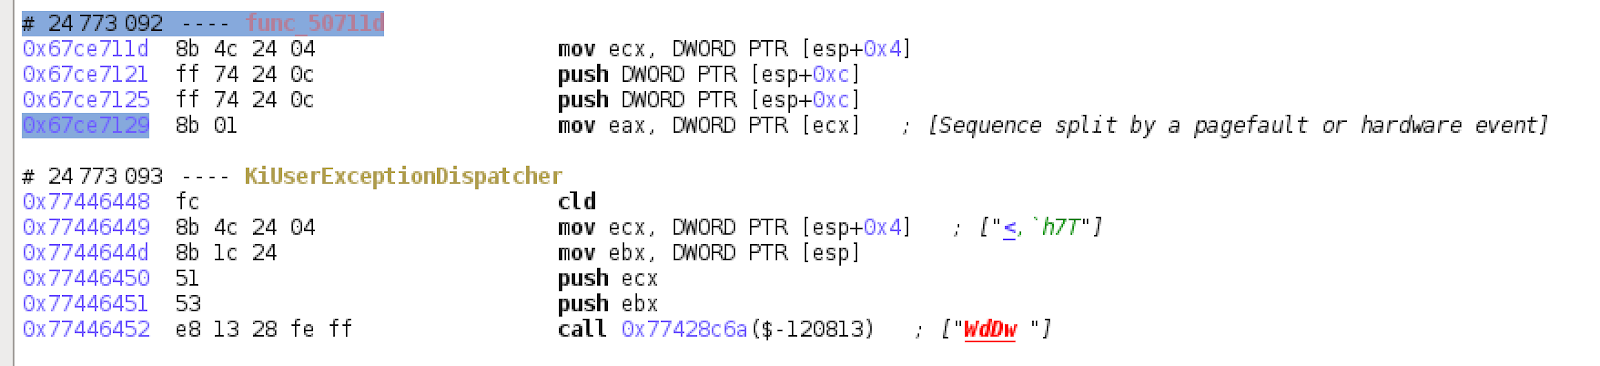
The sequence just before the execution was continued at `KiUserExceptionDispatcher` and was stopped due to a pagefault or hardware event. This checks out:
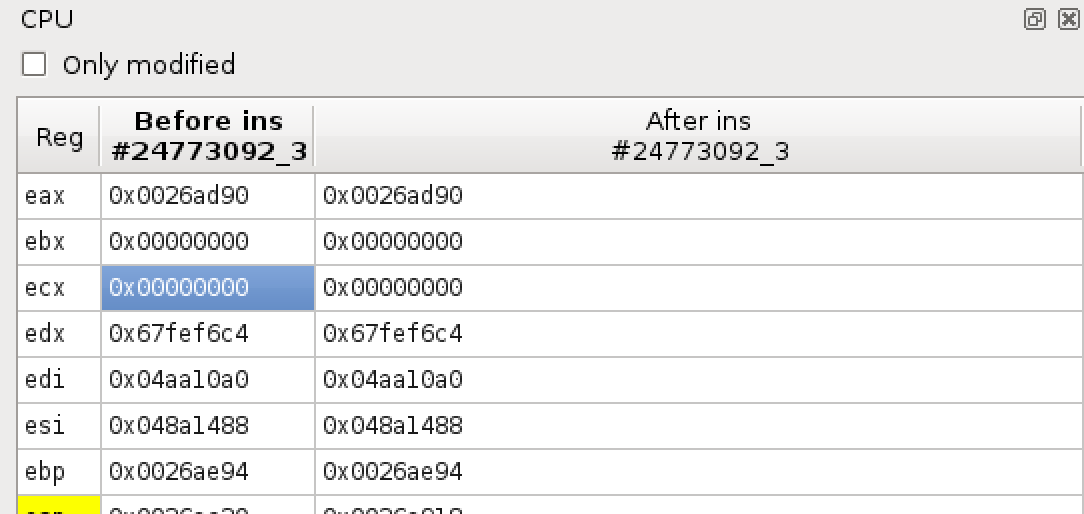
The value in `ecx` is zero, causing an access violation, just like in the windbg output we saw at the start.
Analyzing the crash
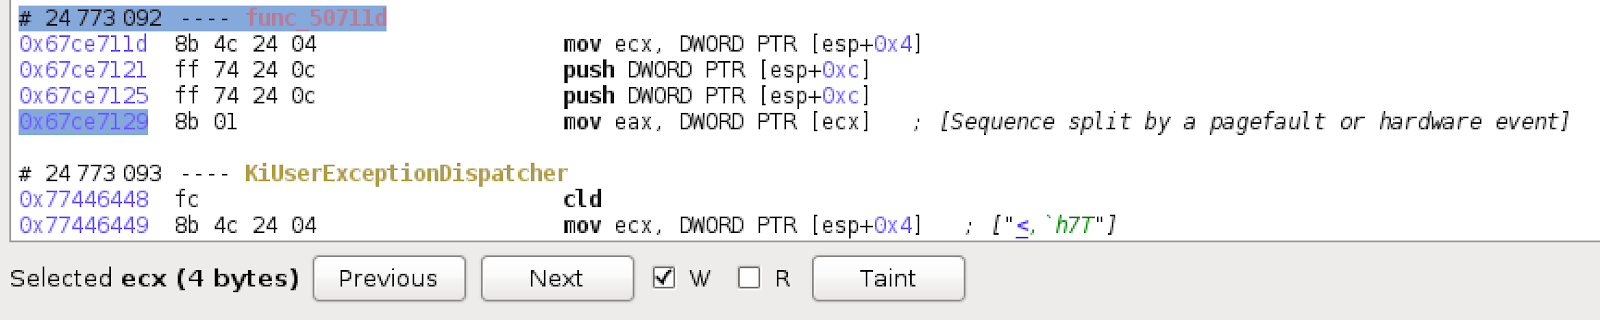
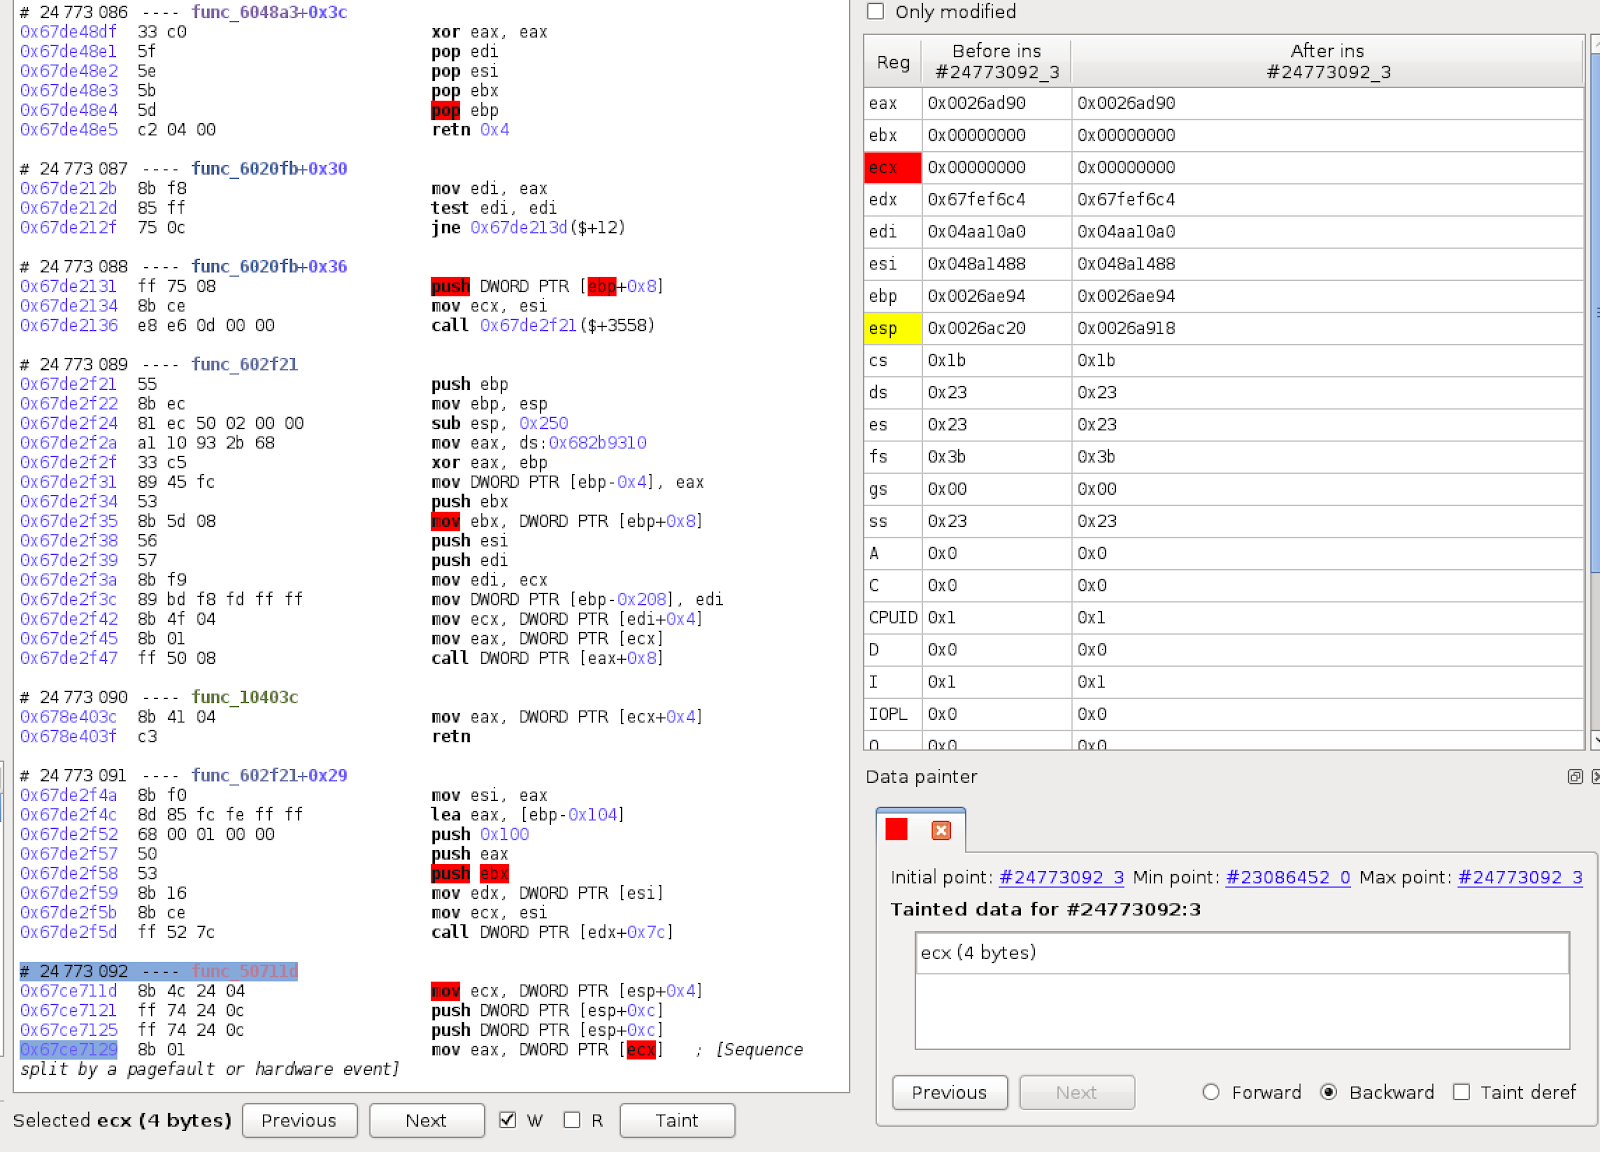
Now that we found the crash, how can we confirm that it is indeed an uncontrollable NULL pointer dereference? First, where did the NULL in `ecx` first come from? Selecting the `ecx` register at the point of the crash allows us to go to its previous uses, and also lets us do taint tracking on it:
We can get a manageable view of the register by visualizing the taint tracking and trimming operations that are irrelevant to our analysis.
But that can get tiring pretty quickly, and we can do one better. We can use Reven’s taint graph:
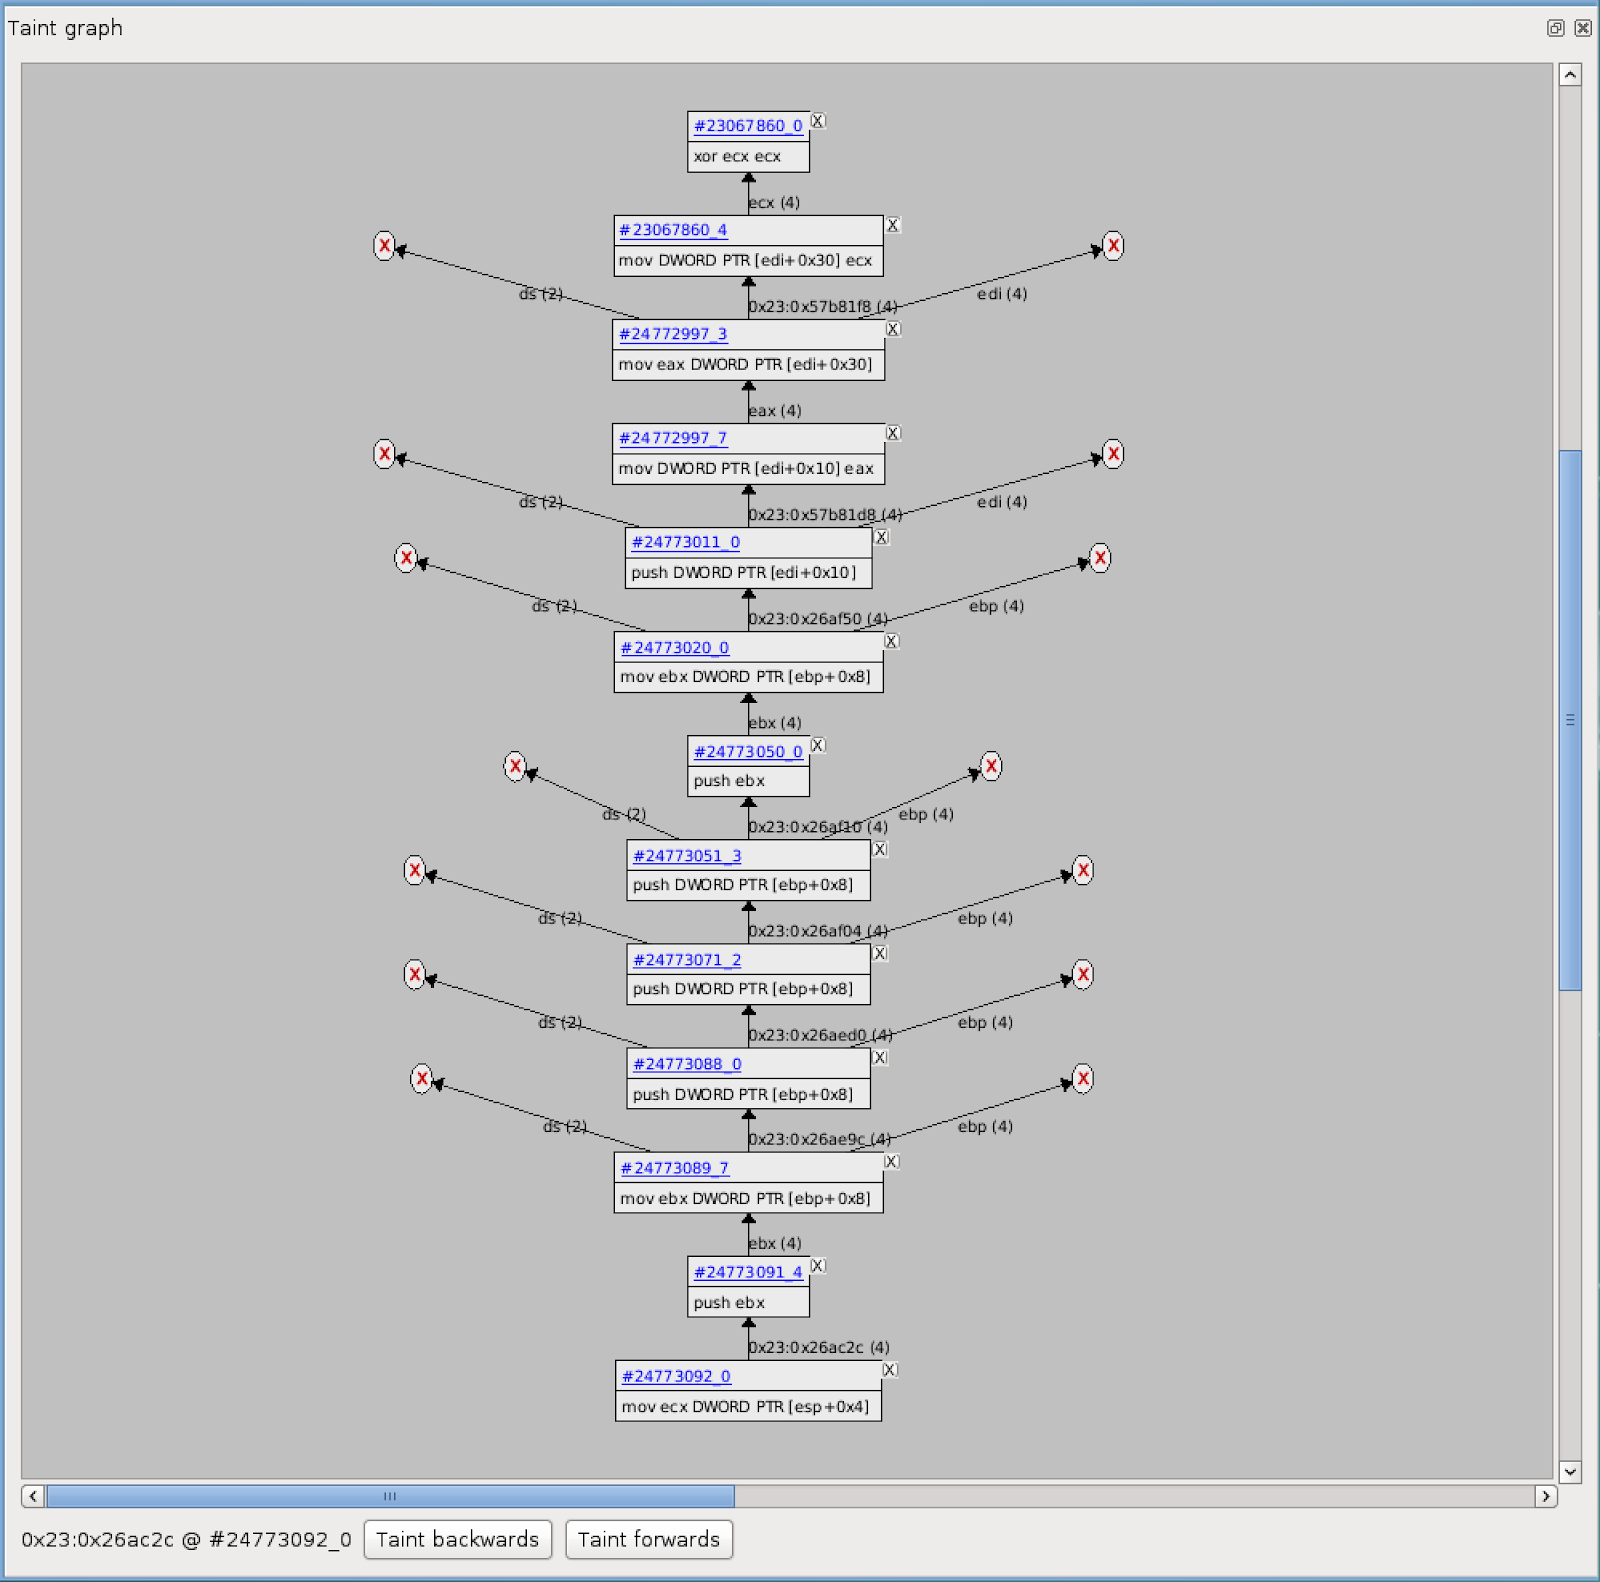
In this trimmed graph, we follow the actual data to its source. Starting from the bottom, we can track where the NULL value in `ecx` comes from. Ultimately, the NULL value comes from `xor ecx,ecx`, where an object field value is initialized at sequence 23067860, instruction 4. Another interesting thing to note is that there has been quite a bit of code executed between when this field was initialized at sequence 23067860 and when it was first accessed at sequence 24772997, which is relatively close to the time of the crash at 24773092.
We can cross-reference this information with the memory access history. If we examine the memory pointed to by `edi+0x30` in the second instruction in the above graph, we can see the following:
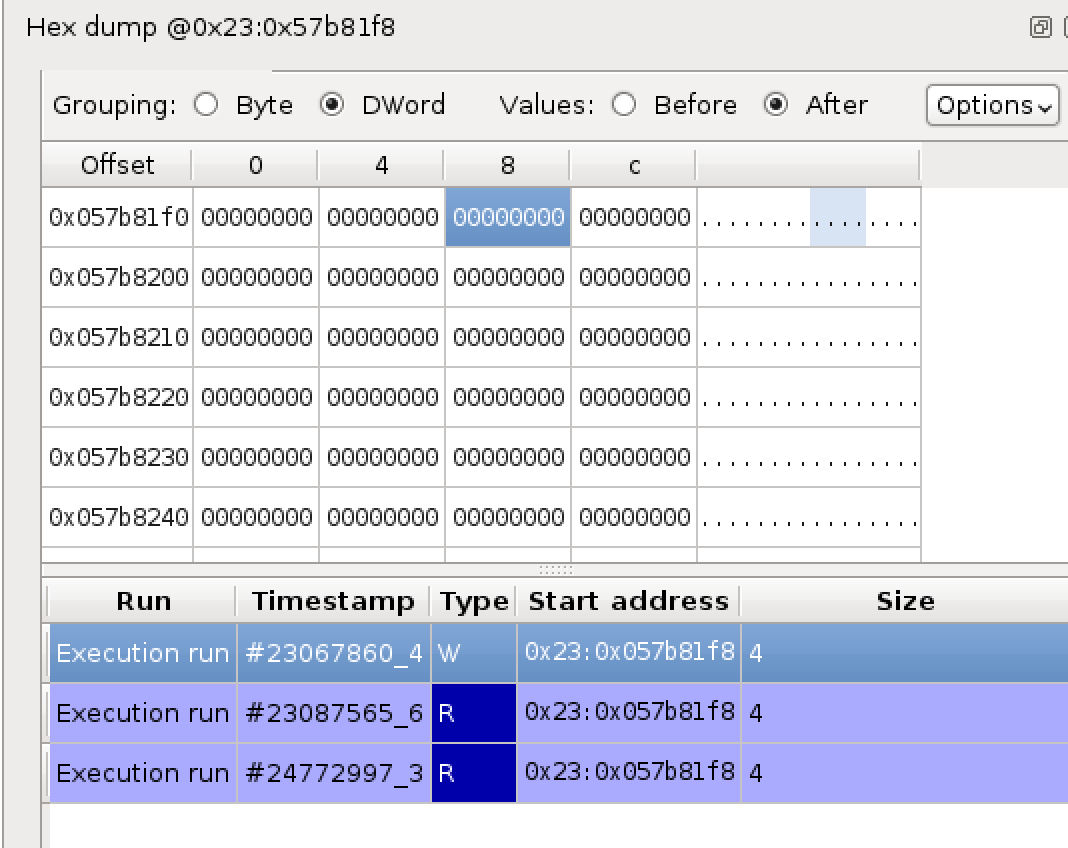
Above, we can see that it was written to once in the sequence that we are examining, and read only twice. The first read didn’t lead anywhere, but the second actually leads to a crash further down the line.
If we follow the execution backward, we can see that the code that set the object field to NULL was part of the constructor. We can come to the conclusion that the field in question was safely initialized to NULL and was never assigned an actual value, and ended up being dereferenced, leading to a crash. In this case, this allows us to conclude we can’t get control over the final value of `ecx` at the time of the crash, which means this bug is not exploitable.
Conclusion
It’s hard to identify if a bug that causes a crash can also result in arbitrary code execution. In the case of a NULL pointer dereference, it involves tracing the path of execution back in time from the crash to where the pointer was initialised.
Traditional analysis methods are time-consuming and involved. Using tools such as REVEN allows analysts to identify paths of execution quickly. Visualizing the execution path and machine state, not only improves analyst productivity, but also explains the root cause of bugs.